Metadata
Description
Dataset name: Demonstration data based on the CCHS 2015 - Nutrition
Sample of 1,000 respondents aged 19-70 y selected proportionally to sampling weights from the CCHS 2015 - Nutrition (PUMF)
Metadata for search engines
Temporal Coverage: 2015
Spatial Coverage: Canada
Citation: Adapted from Statistics Canada, Canadian Community Health Survey - Nutrition: Public Use Microdata File, 2015, April 2023. This does not constitute an endorsement by Statistics Canada of this product.
URL: https://www150.statcan.gc.ca/n1/en/catalogue/82M0024X2018001
Date published: 2018-12-21
|
#Variables
participantid
Unique identifier
Distribution
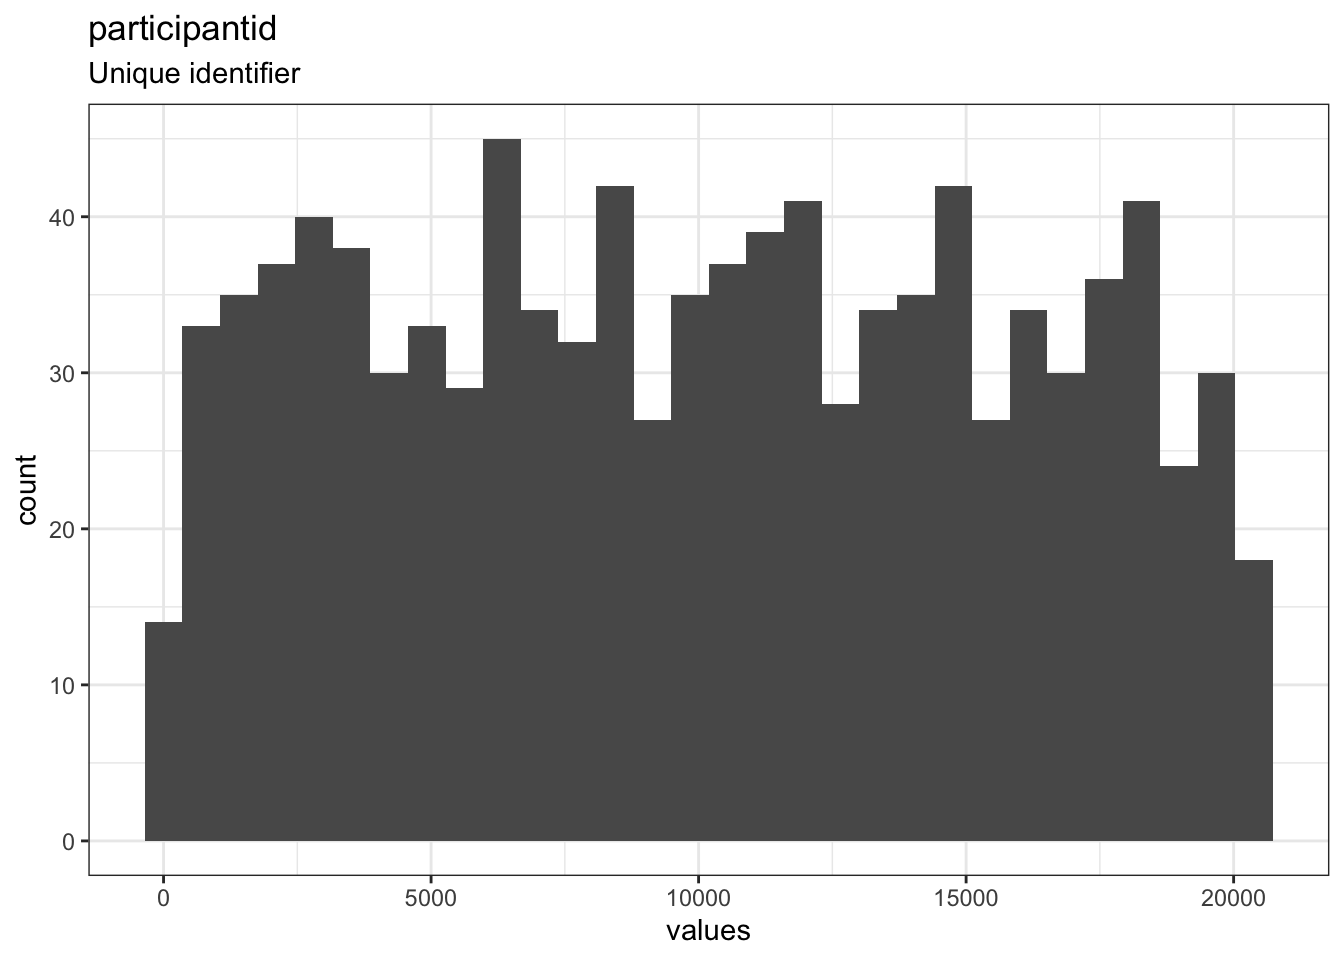
0 missing values.
Summary statistics
| name | label | data_type | n_missing | complete_rate | min | median | max | mean | sd | hist |
|---|---|---|---|---|---|---|---|---|---|---|
| participantid | Unique identifier | numeric | 0 | 1 | 76 | 10126 | 20460 | 10070.82 | 5814.581 | ▇▇▇▇▇ |
r24_season
Season (24-h dietary recall)
Distribution
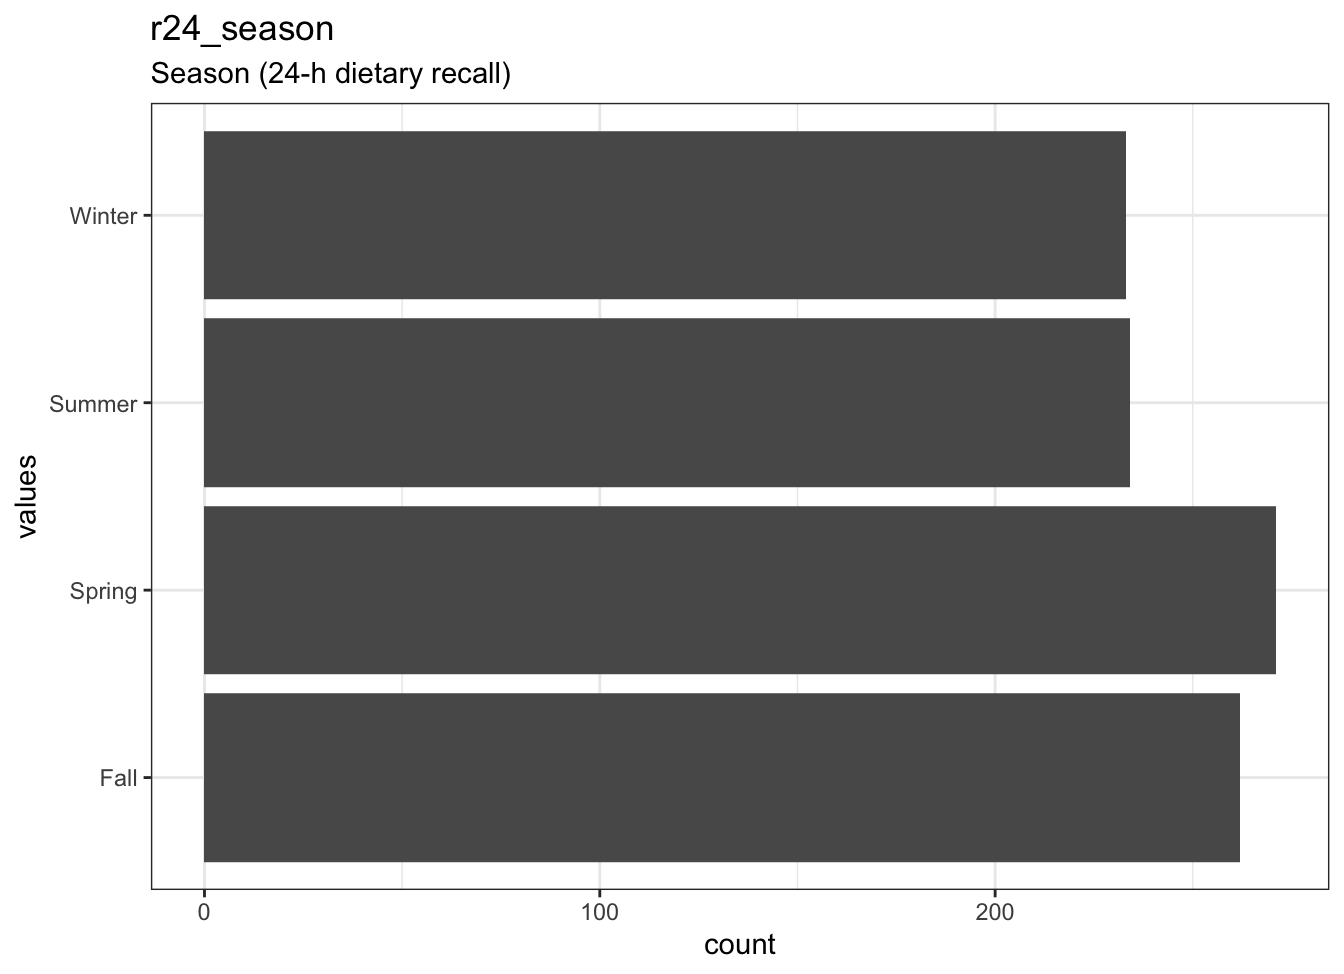
0 missing values.
Summary statistics
| name | label | data_type | n_missing | complete_rate | n_unique | empty | min | max | whitespace |
|---|---|---|---|---|---|---|---|---|---|
| r24_season | Season (24-h dietary recall) | character | 0 | 1 | 4 | 0 | 4 | 6 | 0 |
r24_weekend
Weekend (24-h dietary recall)
Distribution
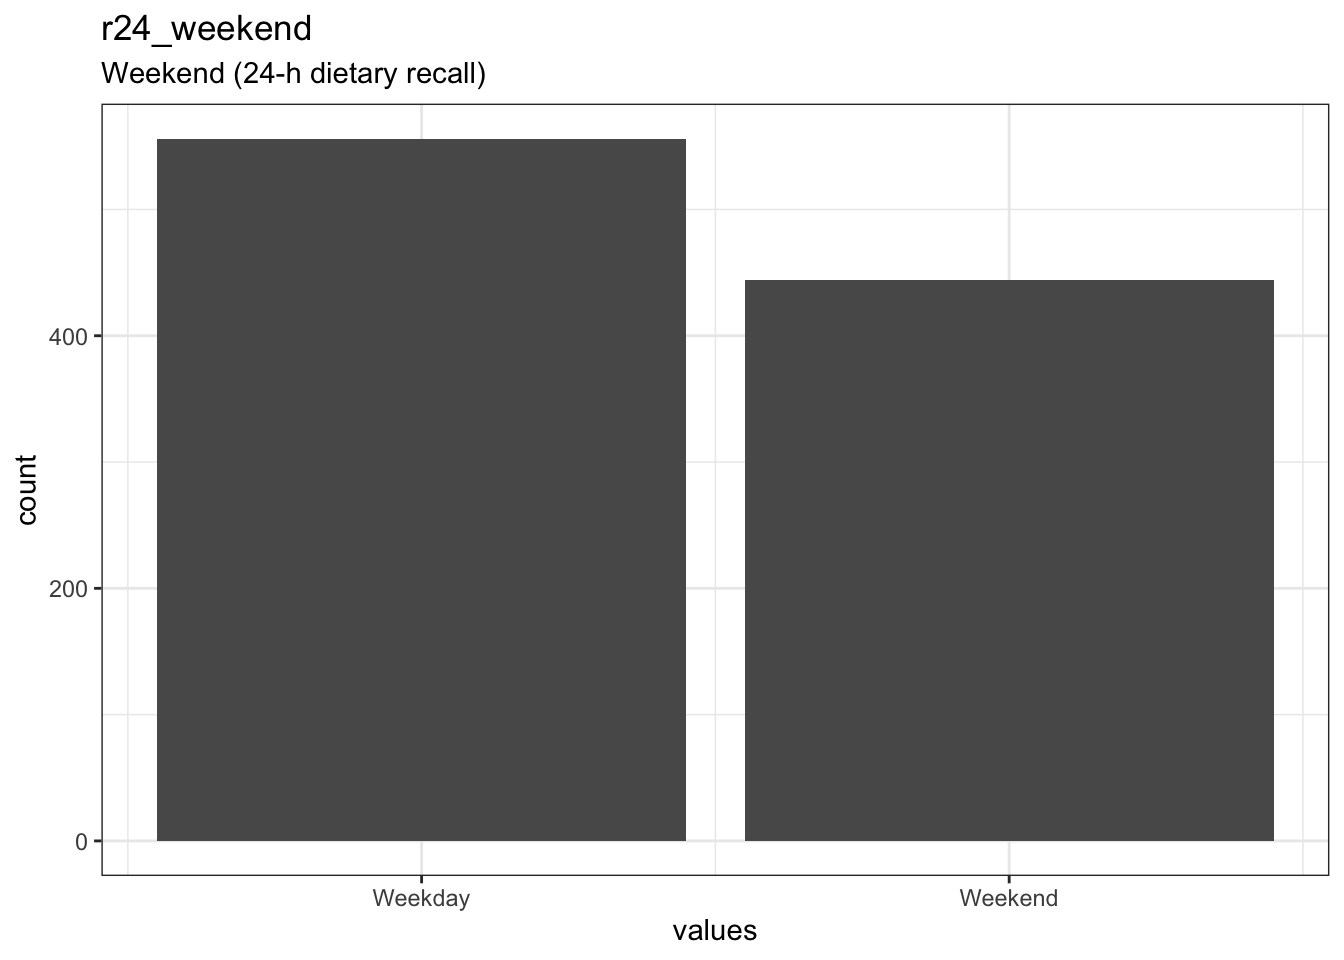
0 missing values.
Summary statistics
| name | label | data_type | n_missing | complete_rate | min | median | max | mean | sd | n_value_labels | hist |
|---|---|---|---|---|---|---|---|---|---|---|---|
| r24_weekend | Weekend (24-h dietary recall) | haven_labelled | 0 | 1 | 0 | 0 | 1 | 0.444 | 0.4971027 | 2 | ▇▁▁▁▁▁▁▆ |
Value labels
| name | value |
|---|---|
| Weekday | 0 |
| Weekend | 1 |
r24_nfoods
Number of items reported (24-h dietary recall)
Distribution
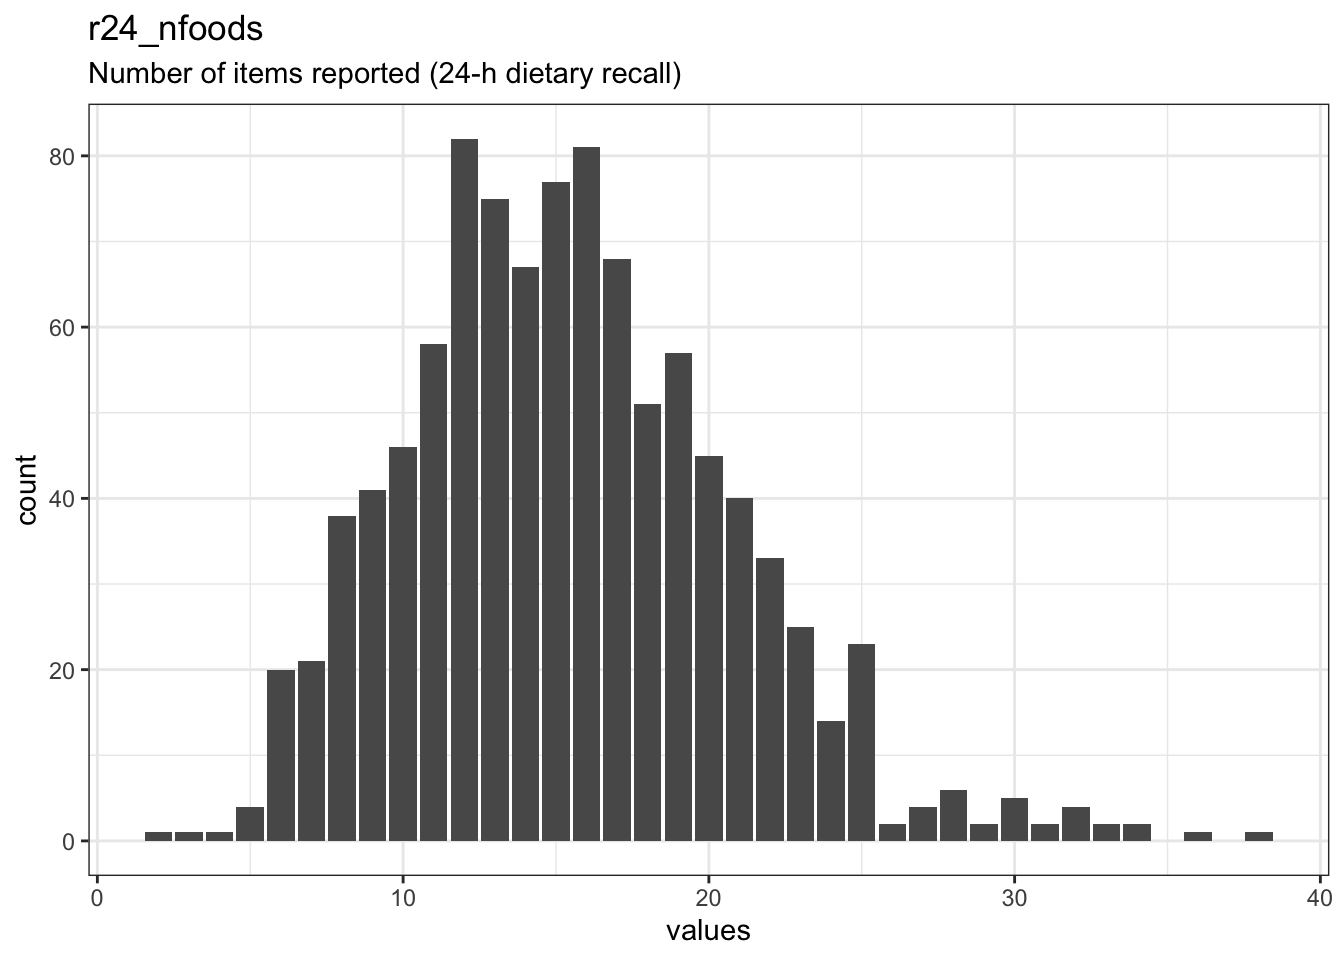
0 missing values.
Summary statistics
| name | label | data_type | n_missing | complete_rate | min | median | max | mean | sd | hist |
|---|---|---|---|---|---|---|---|---|---|---|
| r24_nfoods | Number of items reported (24-h dietary recall) | numeric | 0 | 1 | 2 | 15 | 38 | 15.458 | 5.332417 | ▂▇▅▁▁ |
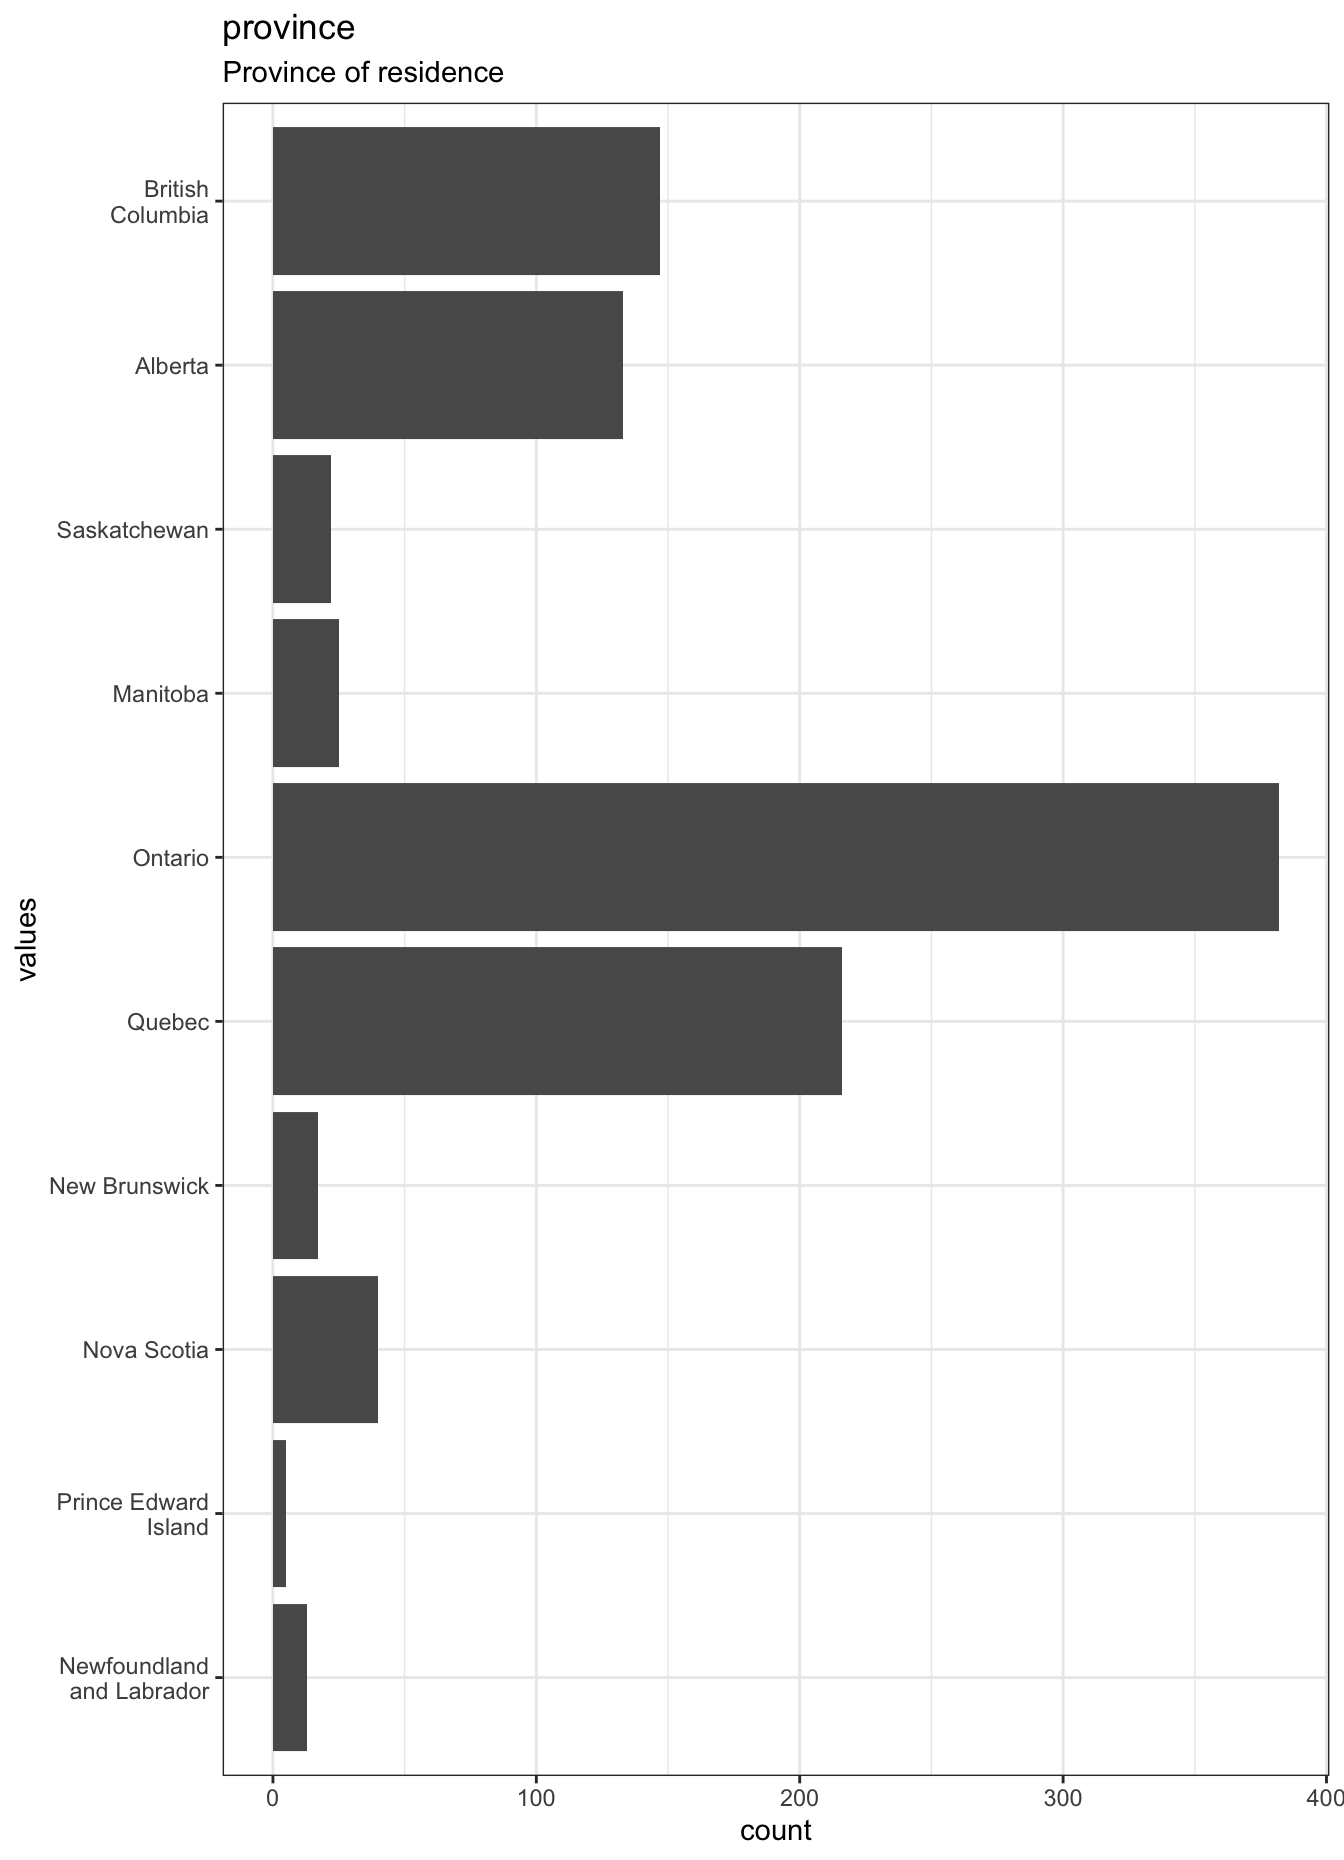
province
Province of residence
Distribution
0 missing values.
Summary statistics
| name | label | data_type | ordered | value_labels | n_missing | complete_rate | n_unique | top_counts |
|---|---|---|---|---|---|---|---|---|
| province | Province of residence | factor | FALSE | 1. Newfoundland and Labrador, 2. Prince Edward Island, 3. Nova Scotia, 4. New Brunswick, 5. Quebec, 6. Ontario, 7. Manitoba, 8. Saskatchewan, 9. Alberta, 10. British Columbia |
0 | 1 | 10 | Ont: 382, Que: 216, Bri: 147, Alb: 133 |
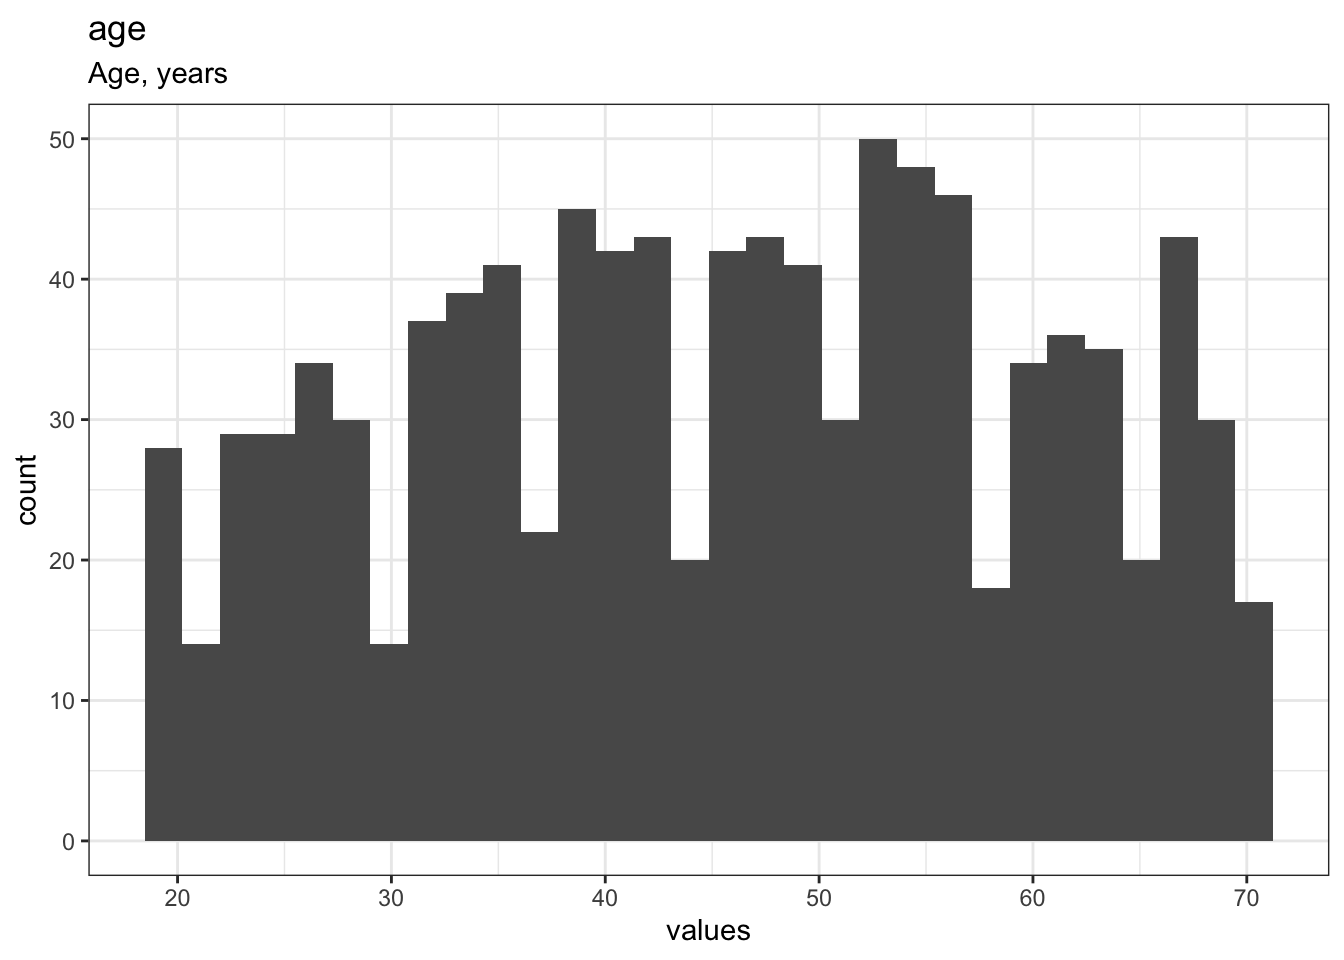
age
Age, years
Distribution
0 missing values.
Summary statistics
| name | label | data_type | n_missing | complete_rate | min | median | max | mean | sd | hist |
|---|---|---|---|---|---|---|---|---|---|---|
| age | Age, years | numeric | 0 | 1 | 19 | 46 | 70 | 45.531 | 14.09936 | ▆▇▇▇▇ |
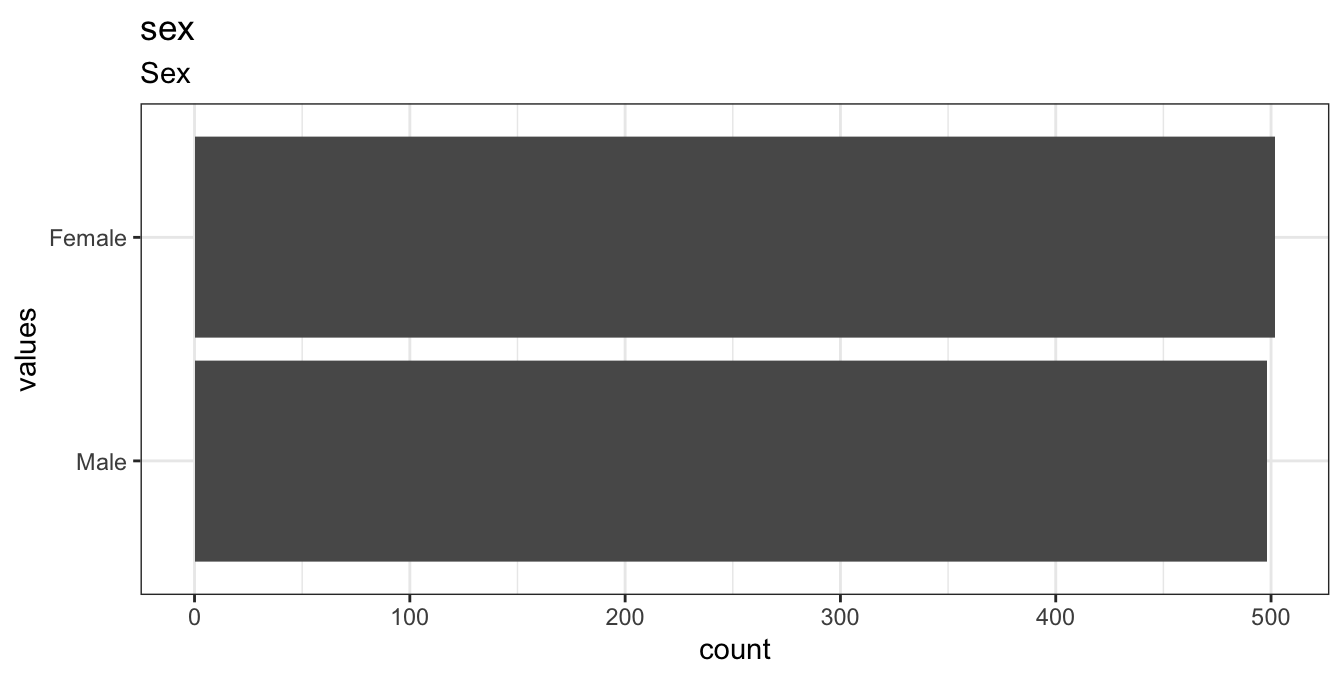
sex
Sex
Distribution
0 missing values.
Summary statistics
| name | label | data_type | ordered | value_labels | n_missing | complete_rate | n_unique | top_counts |
|---|---|---|---|---|---|---|---|---|
| sex | Sex | factor | FALSE | 1. Male, 2. Female |
0 | 1 | 2 | Fem: 502, Mal: 498 |
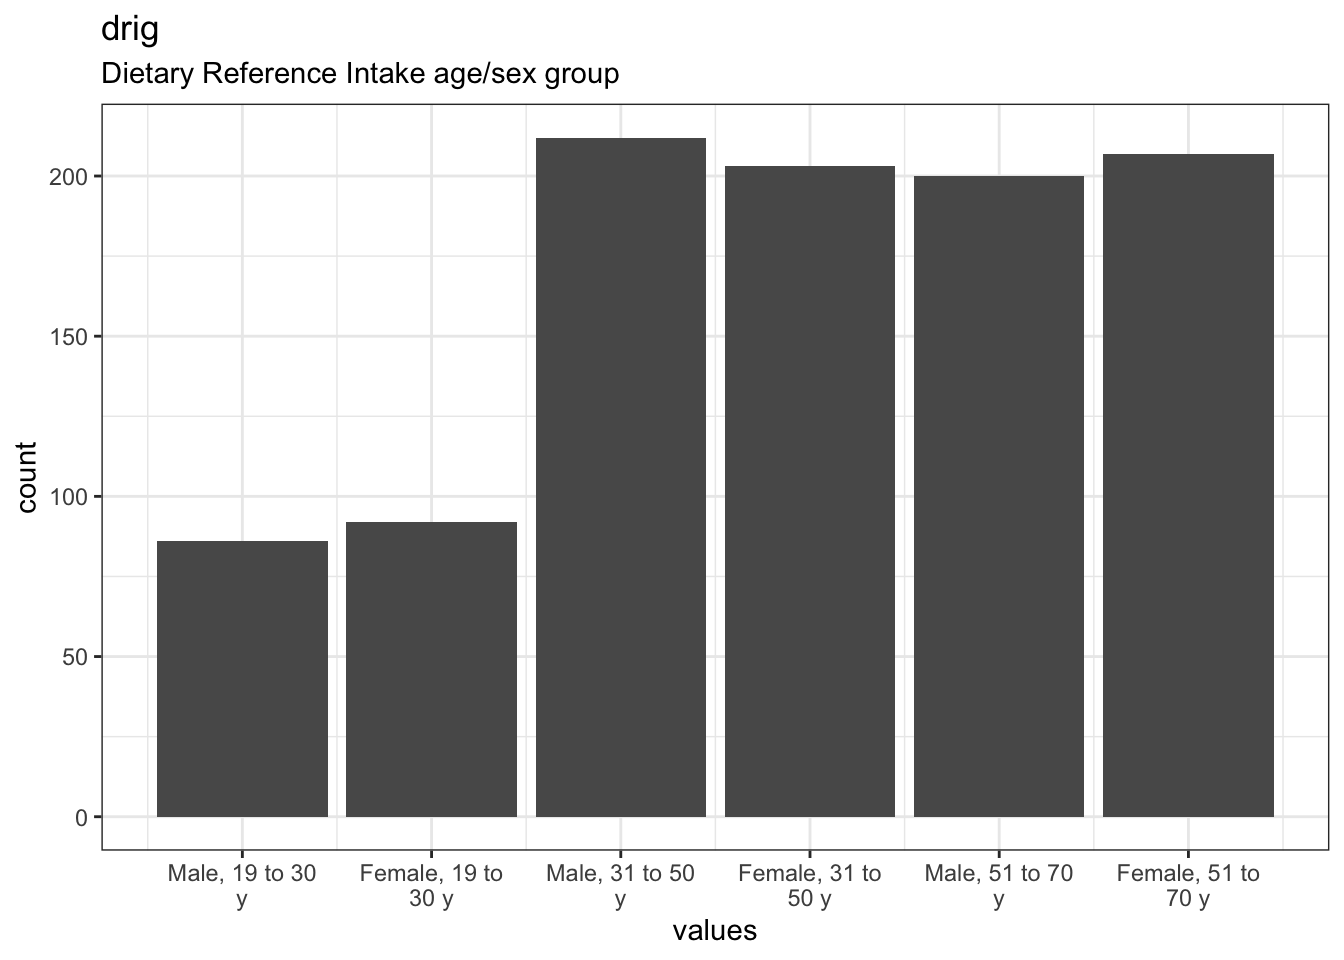
drig
Dietary Reference Intake age/sex group
Distribution
0 missing values.
Summary statistics
| name | label | data_type | n_missing | complete_rate | min | median | max | mean | sd | n_value_labels | hist |
|---|---|---|---|---|---|---|---|---|---|---|---|
| drig | Dietary Reference Intake age/sex group | haven_labelled | 0 | 1 | 8 | 11 | 13 | 10.96 | 1.543627 | 6 | ▃▃▁▇▇▁▇▇ |
Value labels
| name | value |
|---|---|
| Male, 19 to 30 y | 8 |
| Female, 19 to 30 y | 9 |
| Male, 31 to 50 y | 10 |
| Female, 31 to 50 y | 11 |
| Male, 51 to 70 y | 12 |
| Female, 51 to 70 y | 13 |
education
Education level
Distribution
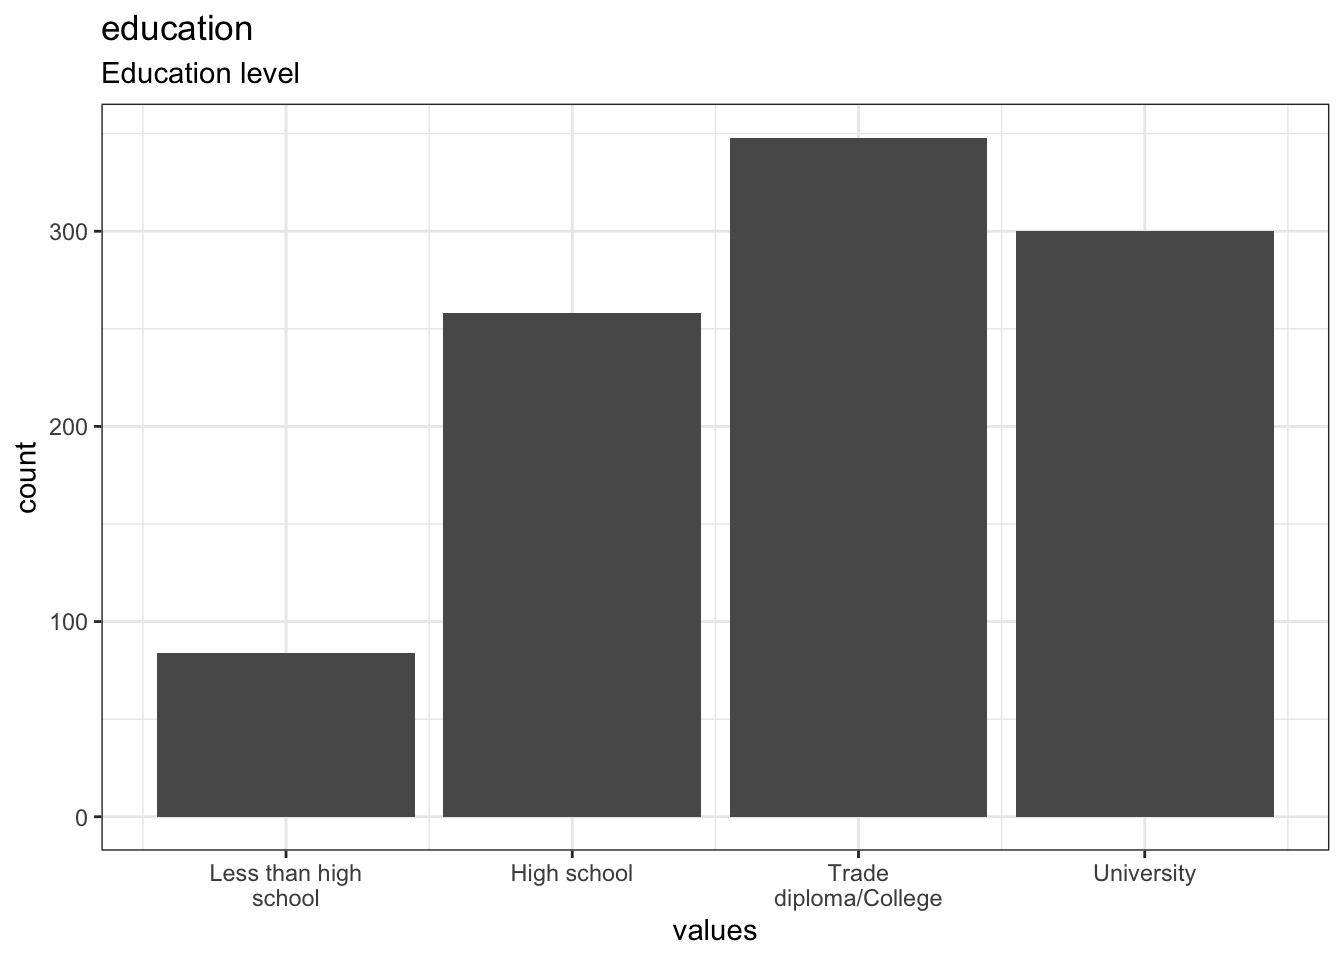
10 missing values.
Summary statistics
| name | label | data_type | n_missing | complete_rate | min | median | max | mean | sd | n_value_labels | hist |
|---|---|---|---|---|---|---|---|---|---|---|---|
| education | Education level | haven_labelled | 10 | 0.99 | 1 | 3 | 4 | 2.872727 | 0.9421935 | 4 | ▂▁▆▁▁▇▁▇ |
Value labels
| name | value |
|---|---|
| Less than high school | 1 |
| High school | 2 |
| Trade diploma/College | 3 |
| University | 4 |
income
Total household income
Distribution
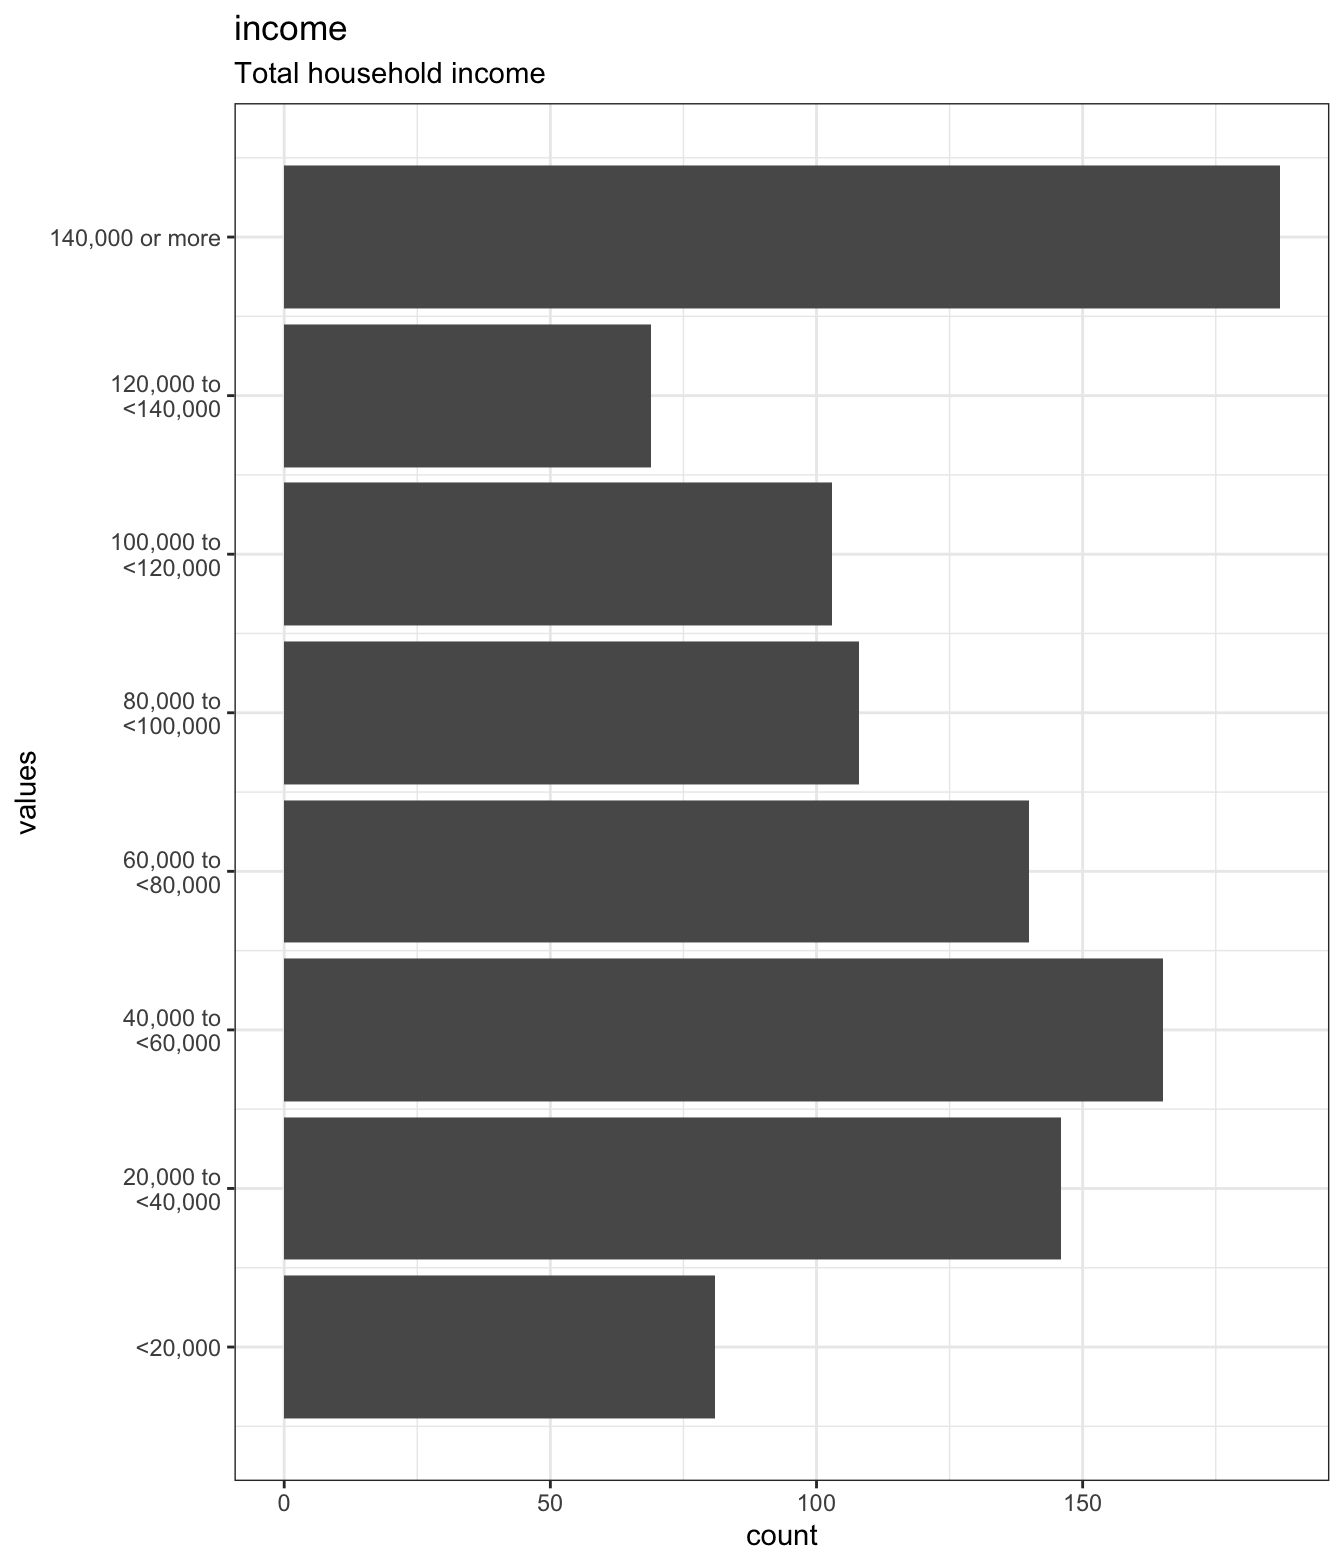
1 missing values.
Summary statistics
| name | label | data_type | n_missing | complete_rate | min | median | max | mean | sd | n_value_labels | hist |
|---|---|---|---|---|---|---|---|---|---|---|---|
| income | Total household income | haven_labelled | 1 | 0.999 | 1 | 4 | 8 | 4.56957 | 2.301632 | 8 | ▃▆▇▆▅▅▃▇ |
Value labels
| name | value |
|---|---|
| <20,000 | 1 |
| 20,000 to <40,000 | 2 |
| 40,000 to <60,000 | 3 |
| 60,000 to <80,000 | 4 |
| 80,000 to <100,000 | 5 |
| 100,000 to <120,000 | 6 |
| 120,000 to <140,000 | 7 |
| 140,000 or more | 8 |
marital_status
Marital status
Distribution
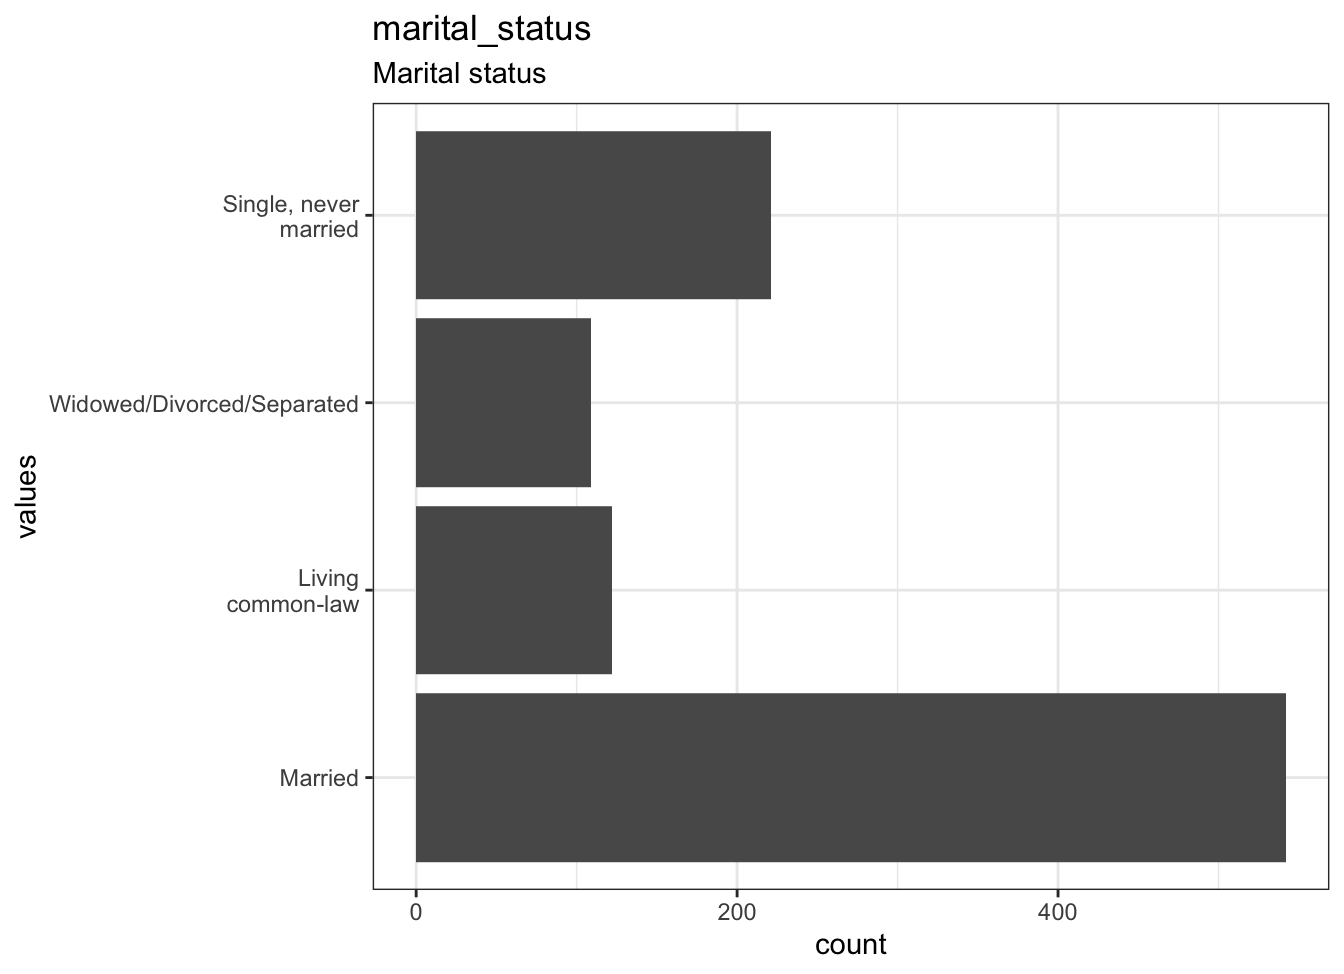
6 missing values.
Summary statistics
| name | label | data_type | ordered | value_labels | n_missing | complete_rate | n_unique | top_counts |
|---|---|---|---|---|---|---|---|---|
| marital_status | Marital status | factor | FALSE | 1. Married, 2. Living common-law, 3. Widowed/Divorced/Separated, 4. Single, never married |
6 | 0.994 | 4 | Mar: 542, Sin: 221, Liv: 122, Wid: 109 |
smoking
Smoking status
Distribution
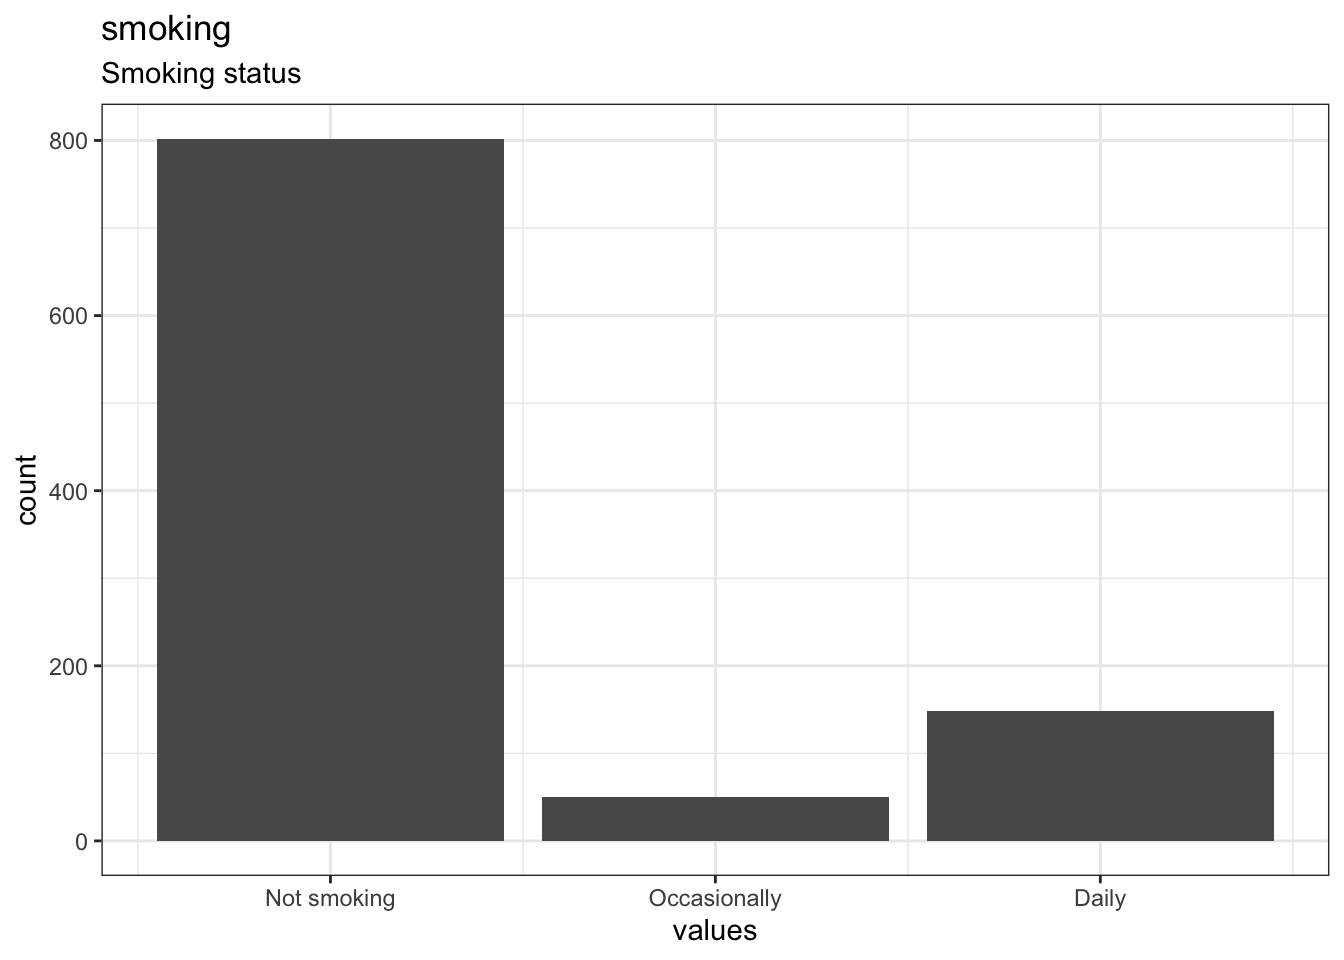
0 missing values.
Summary statistics
| name | label | data_type | n_missing | complete_rate | min | median | max | mean | sd | n_value_labels | hist |
|---|---|---|---|---|---|---|---|---|---|---|---|
| smoking | Smoking status | haven_labelled | 0 | 1 | 0 | 0 | 2 | 0.346 | 0.7230538 | 3 | ▇▁▁▁▁▁▁▂ |
Value labels
| name | value |
|---|---|
| Not smoking | 0 |
| Occasionally | 1 |
| Daily | 2 |
phys_act_mod
Moderate or vigorous physical activity, hours/week
Distribution
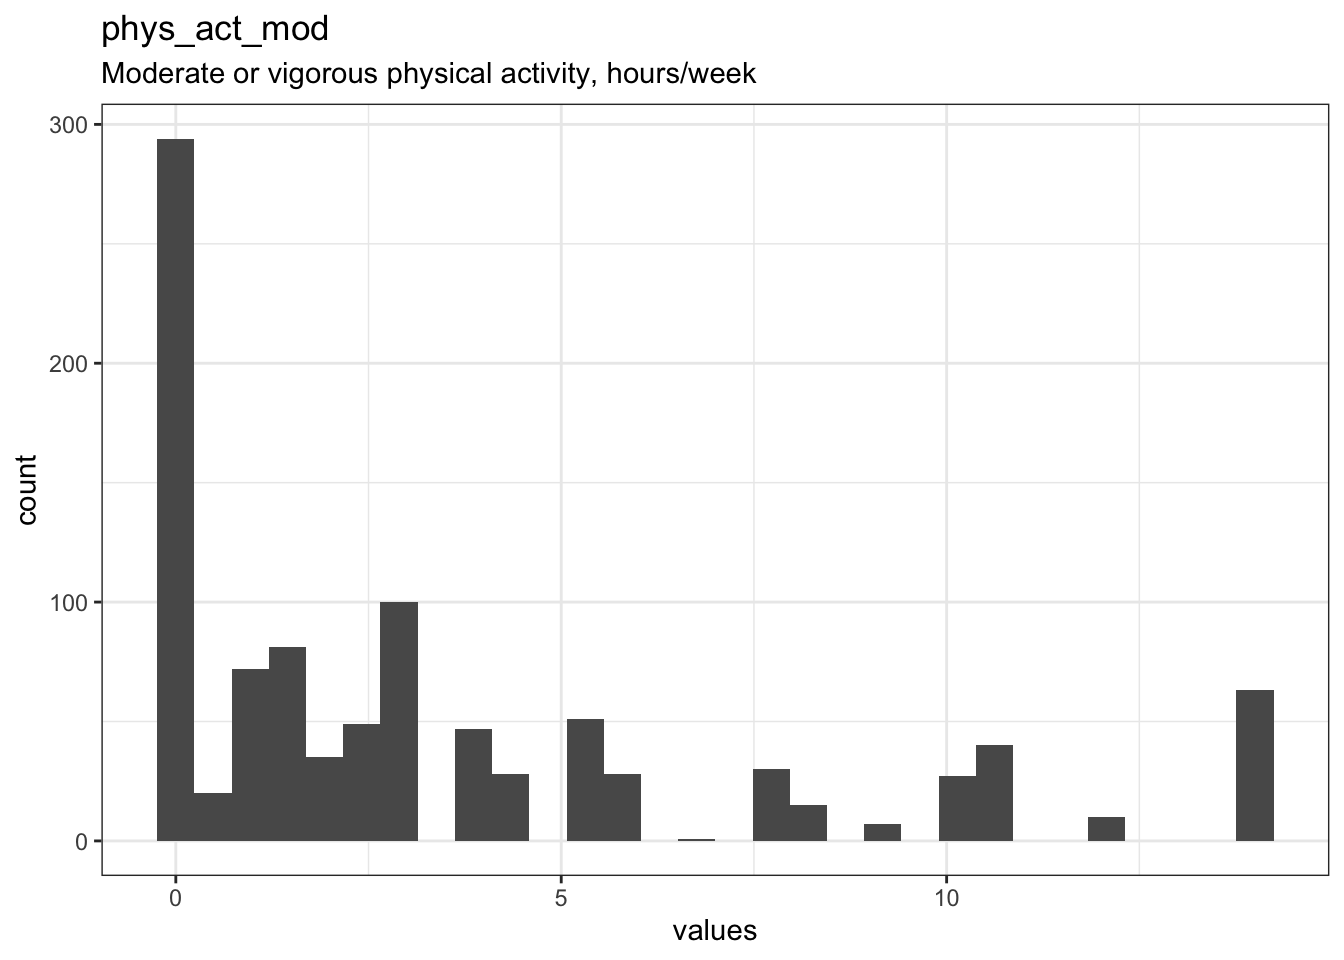
2 missing values.
Summary statistics
| name | label | data_type | n_missing | complete_rate | min | median | max | mean | sd | hist |
|---|---|---|---|---|---|---|---|---|---|---|
| phys_act_mod | Moderate or vigorous physical activity, hours/week | numeric | 2 | 0.998 | 0 | 2 | 14 | 3.52253 | 4.119379 | ▇▃▁▁▁ |
food_security
Household Food Security Status
Distribution
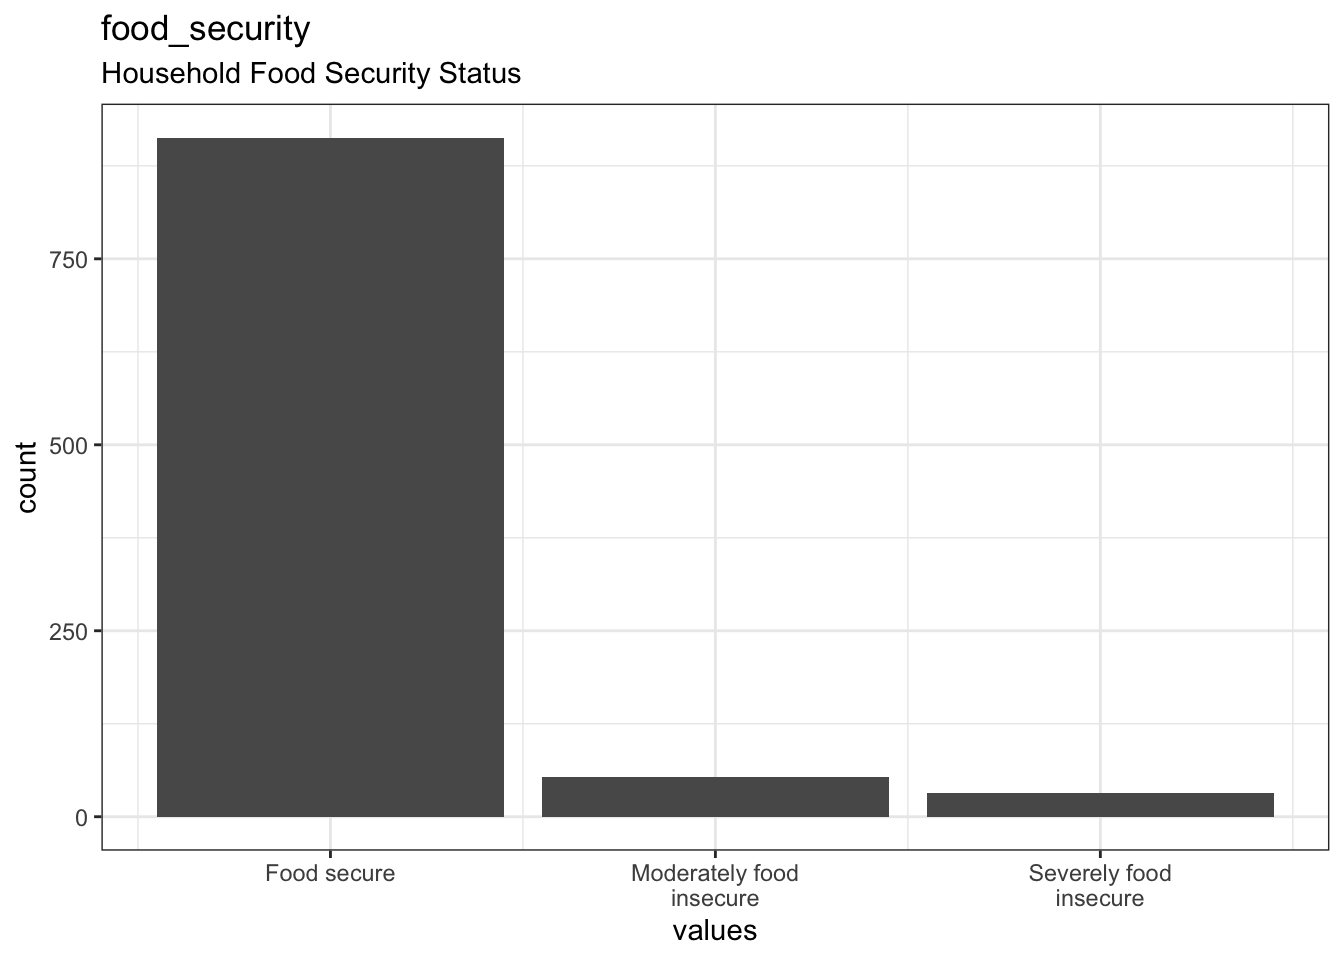
2 missing values.
Summary statistics
| name | label | data_type | n_missing | complete_rate | min | median | max | mean | sd | n_value_labels | hist |
|---|---|---|---|---|---|---|---|---|---|---|---|
| food_security | Household Food Security Status | haven_labelled | 2 | 0.998 | 0 | 0 | 2 | 0.1172345 | 0.409618 | 3 | ▇▁▁▁▁▁▁▁ |
Value labels
| name | value |
|---|---|
| Food secure | 0 |
| Moderately food insecure | 1 |
| Severely food insecure | 2 |
bodyweight
Bodyweight, kg
Distribution
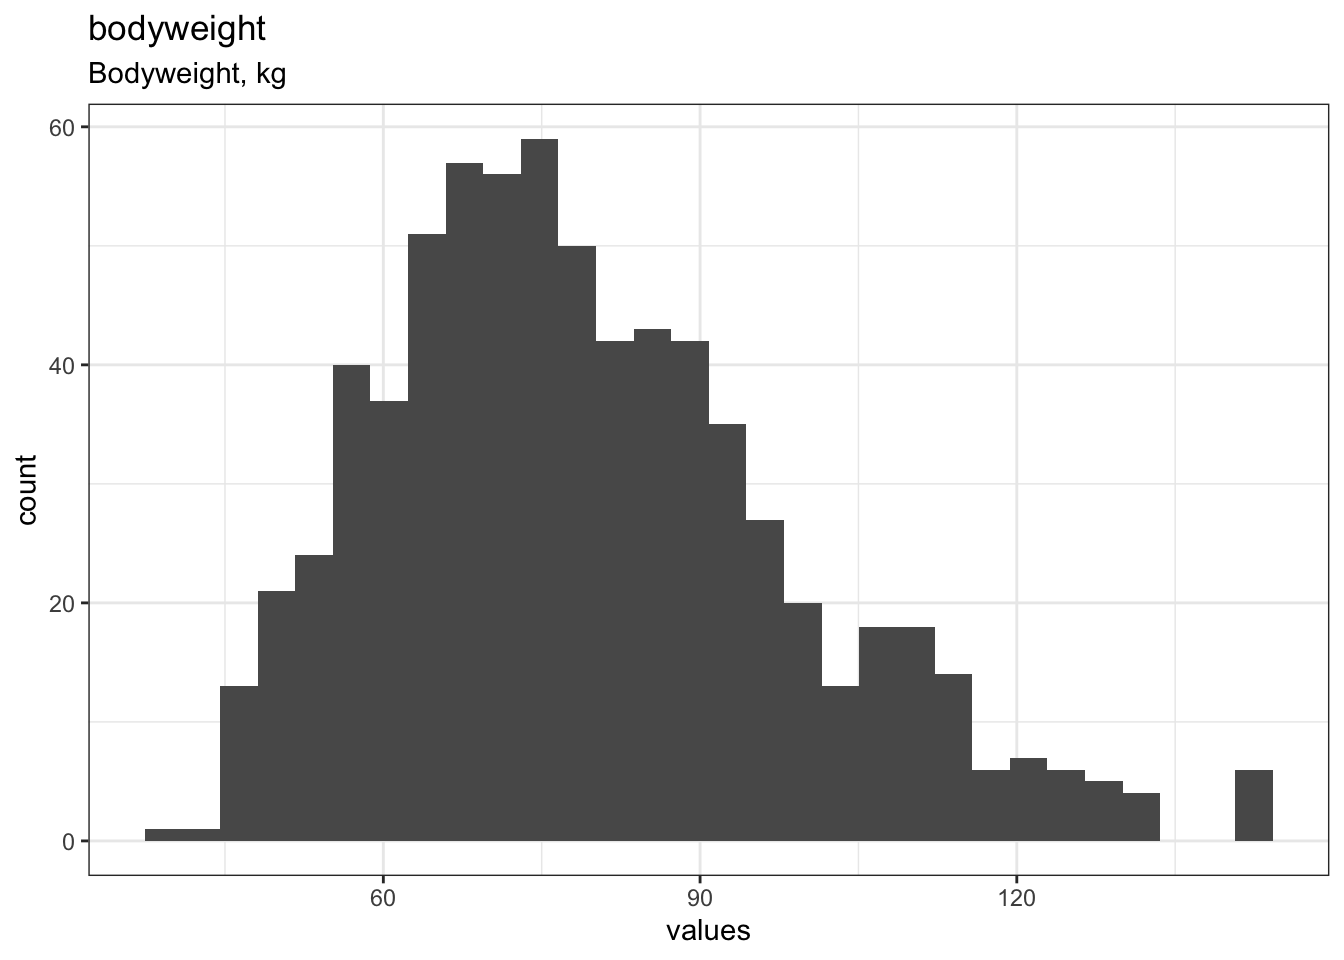
284 missing values.
Summary statistics
| name | label | data_type | n_missing | complete_rate | min | median | max | mean | sd | hist |
|---|---|---|---|---|---|---|---|---|---|---|
| bodyweight | Bodyweight, kg | numeric | 284 | 0.716 | 39 | 76 | 142 | 79.34631 | 19.45663 | ▃▇▆▂▁ |
height
Height, meters
Distribution
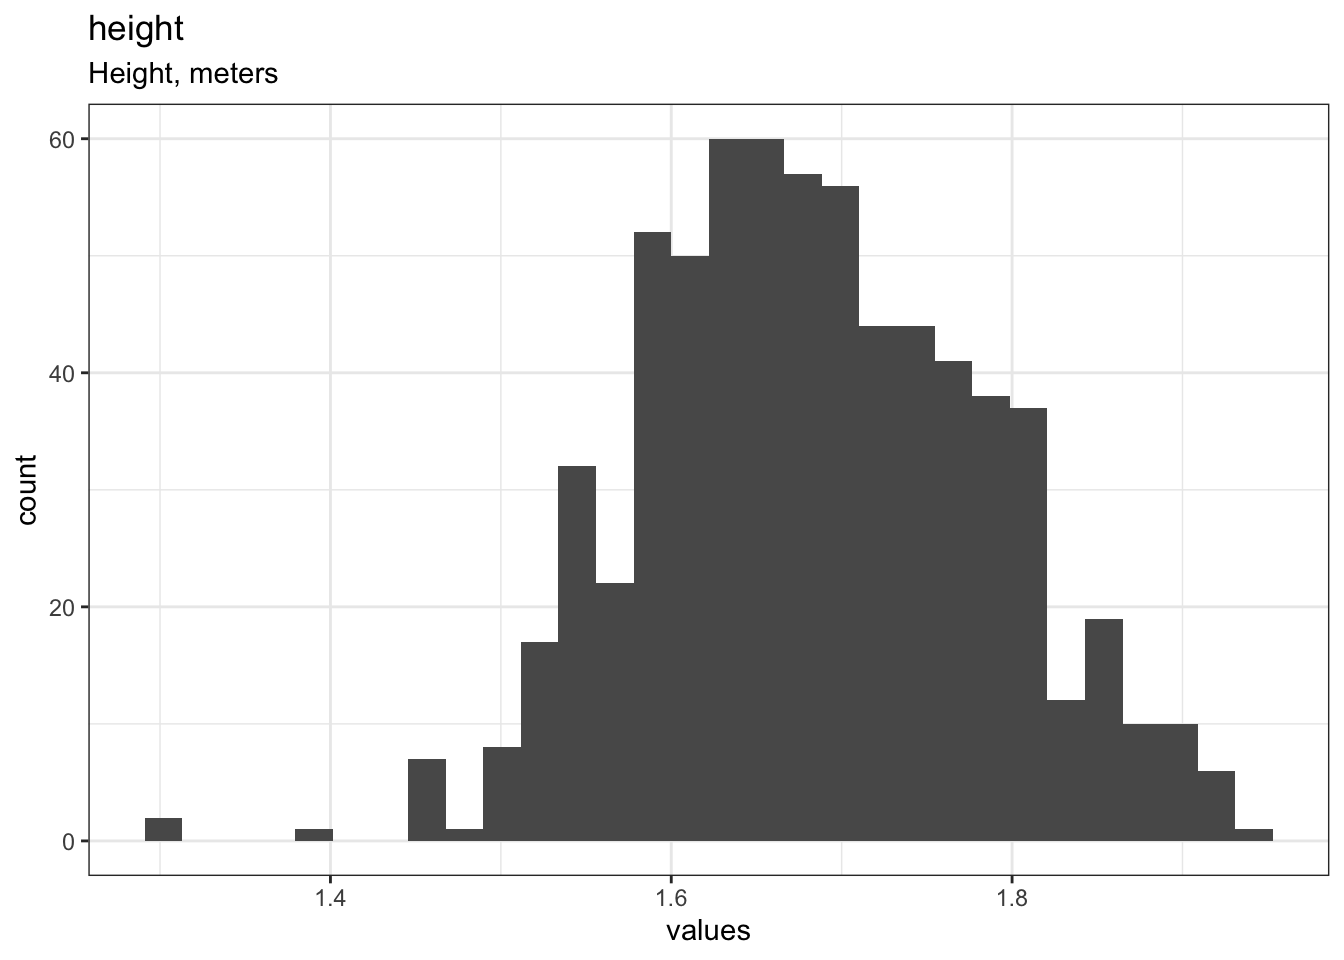
313 missing values.
Summary statistics
| name | label | data_type | n_missing | complete_rate | min | median | max | mean | sd | hist |
|---|---|---|---|---|---|---|---|---|---|---|
| height | Height, meters | numeric | 313 | 0.687 | 1.3 | 1.7 | 1.9 | 1.68436 | 0.0996241 | ▁▂▇▇▂ |
bmi
Body mass index, kg/m2
Distribution
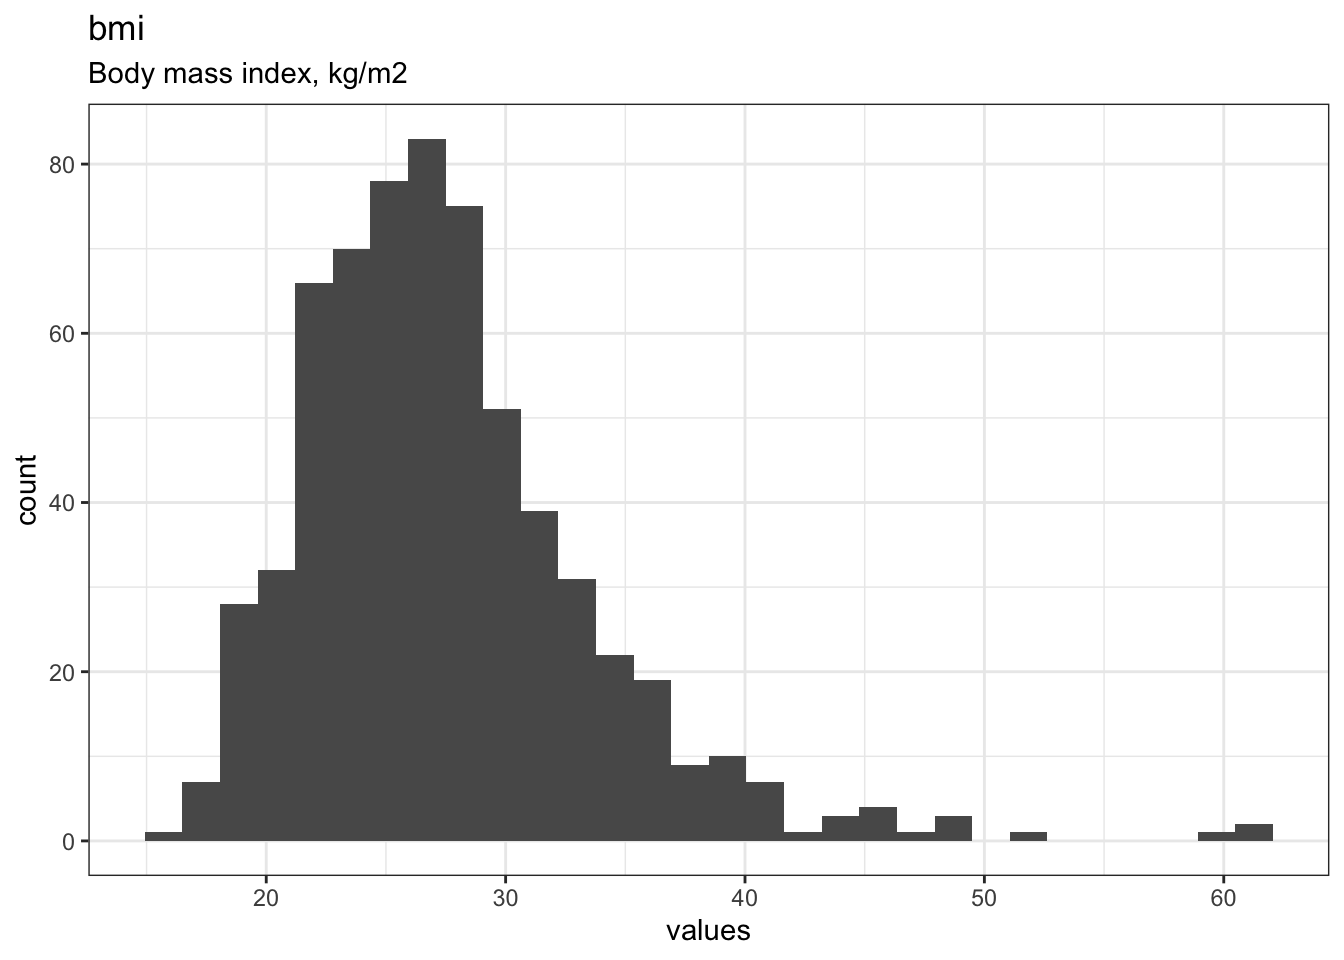
356 missing values.
Summary statistics
| name | label | data_type | n_missing | complete_rate | min | median | max | mean | sd | hist |
|---|---|---|---|---|---|---|---|---|---|---|
| bmi | Body mass index, kg/m2 | numeric | 356 | 0.644 | 16 | 27 | 62 | 27.54818 | 6.130724 | ▇▇▂▁▁ |
self_rated_health
Self-rated health
Distribution
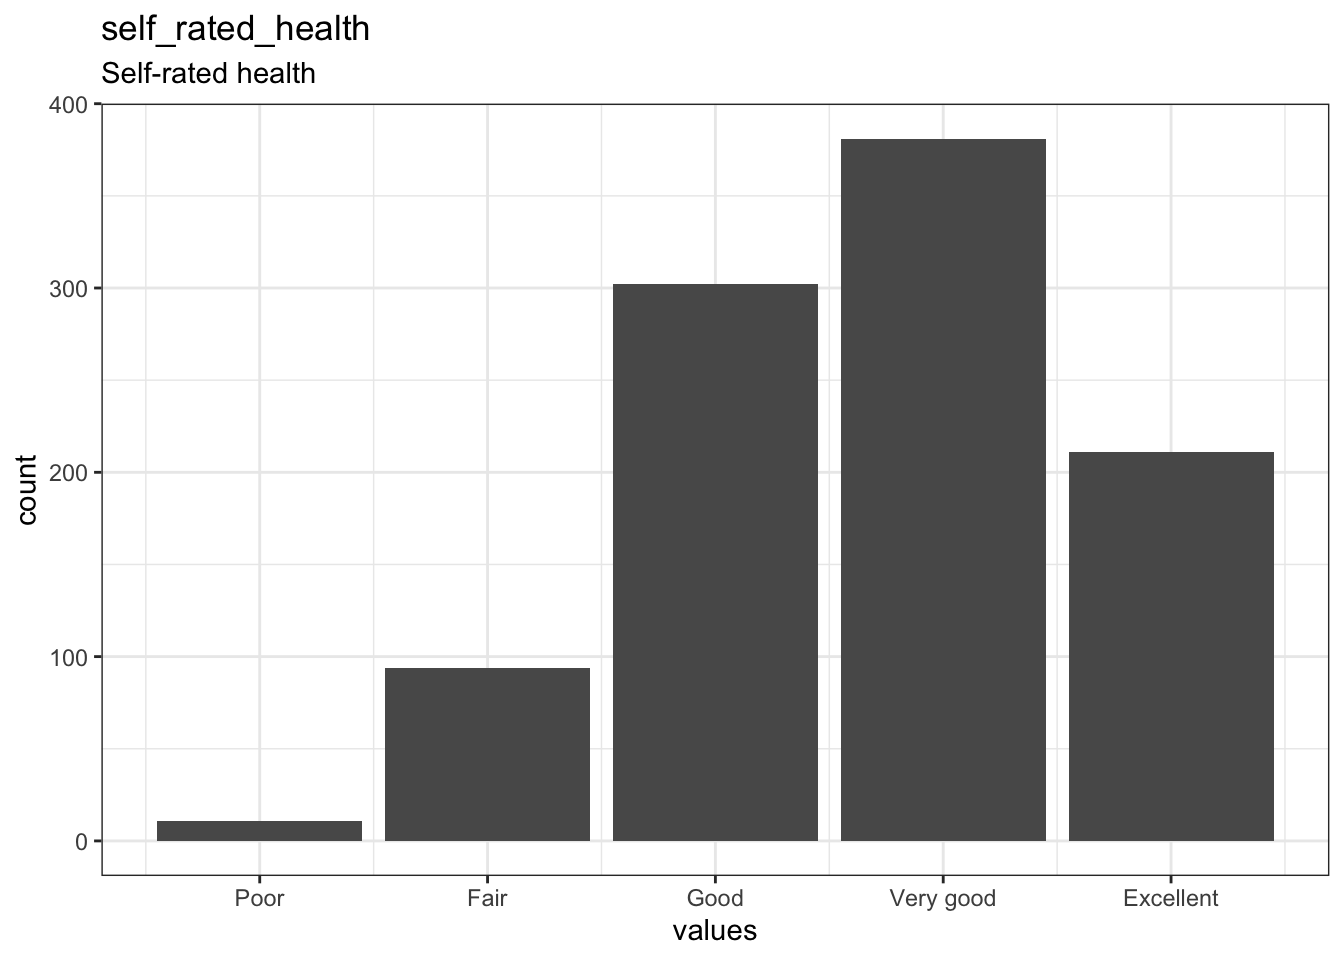
1 missing values.
Summary statistics
| name | label | data_type | n_missing | complete_rate | min | median | max | mean | sd | n_value_labels | hist |
|---|---|---|---|---|---|---|---|---|---|---|---|
| self_rated_health | Self-rated health | haven_labelled | 1 | 0.999 | 0 | 3 | 4 | 2.687688 | 0.9446392 | 5 | ▁▂▁▆▁▇▁▅ |
Value labels
| name | value |
|---|---|
| Poor | 0 |
| Fair | 1 |
| Good | 2 |
| Very good | 3 |
| Excellent | 4 |
self_reported_bp
Self-reported high blood pressure
Distribution
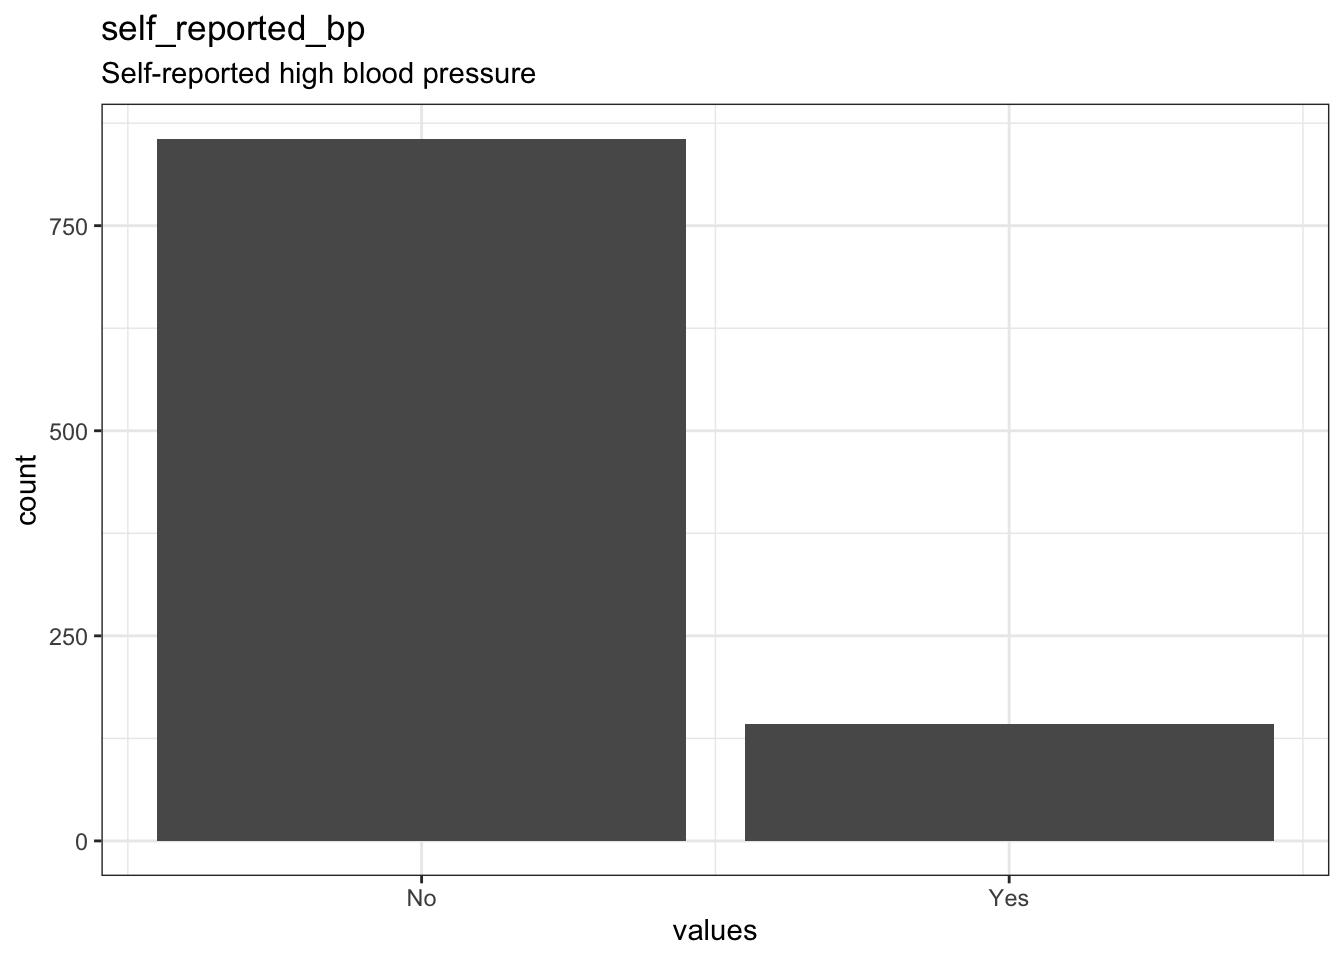
2 missing values.
Summary statistics
| name | label | data_type | n_missing | complete_rate | min | median | max | mean | sd | n_value_labels | hist |
|---|---|---|---|---|---|---|---|---|---|---|---|
| self_reported_bp | Self-reported high blood pressure | haven_labelled | 2 | 0.998 | 0 | 0 | 1 | 0.1422846 | 0.3495169 | 2 | ▇▁▁▁▁▁▁▁ |
Value labels
| name | value |
|---|---|
| No | 0 |
| Yes | 1 |
self_reported_db
Self-reported diabetes
Distribution
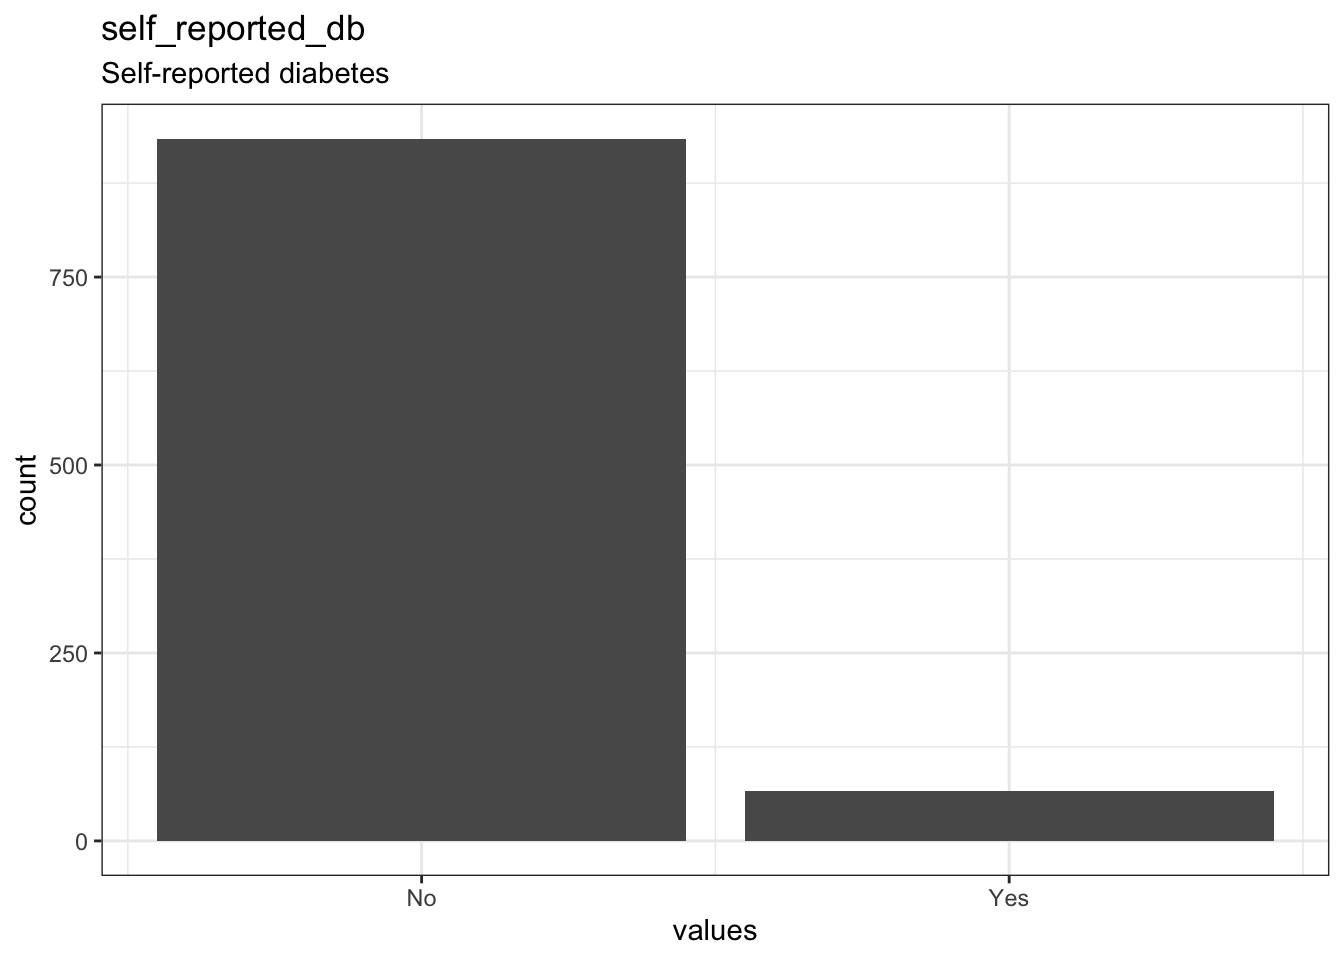
0 missing values.
Summary statistics
| name | label | data_type | n_missing | complete_rate | min | median | max | mean | sd | n_value_labels | hist |
|---|---|---|---|---|---|---|---|---|---|---|---|
| self_reported_db | Self-reported diabetes | haven_labelled | 0 | 1 | 0 | 0 | 1 | 0.066 | 0.2484063 | 2 | ▇▁▁▁▁▁▁▁ |
Value labels
| name | value |
|---|---|
| No | 0 |
| Yes | 1 |
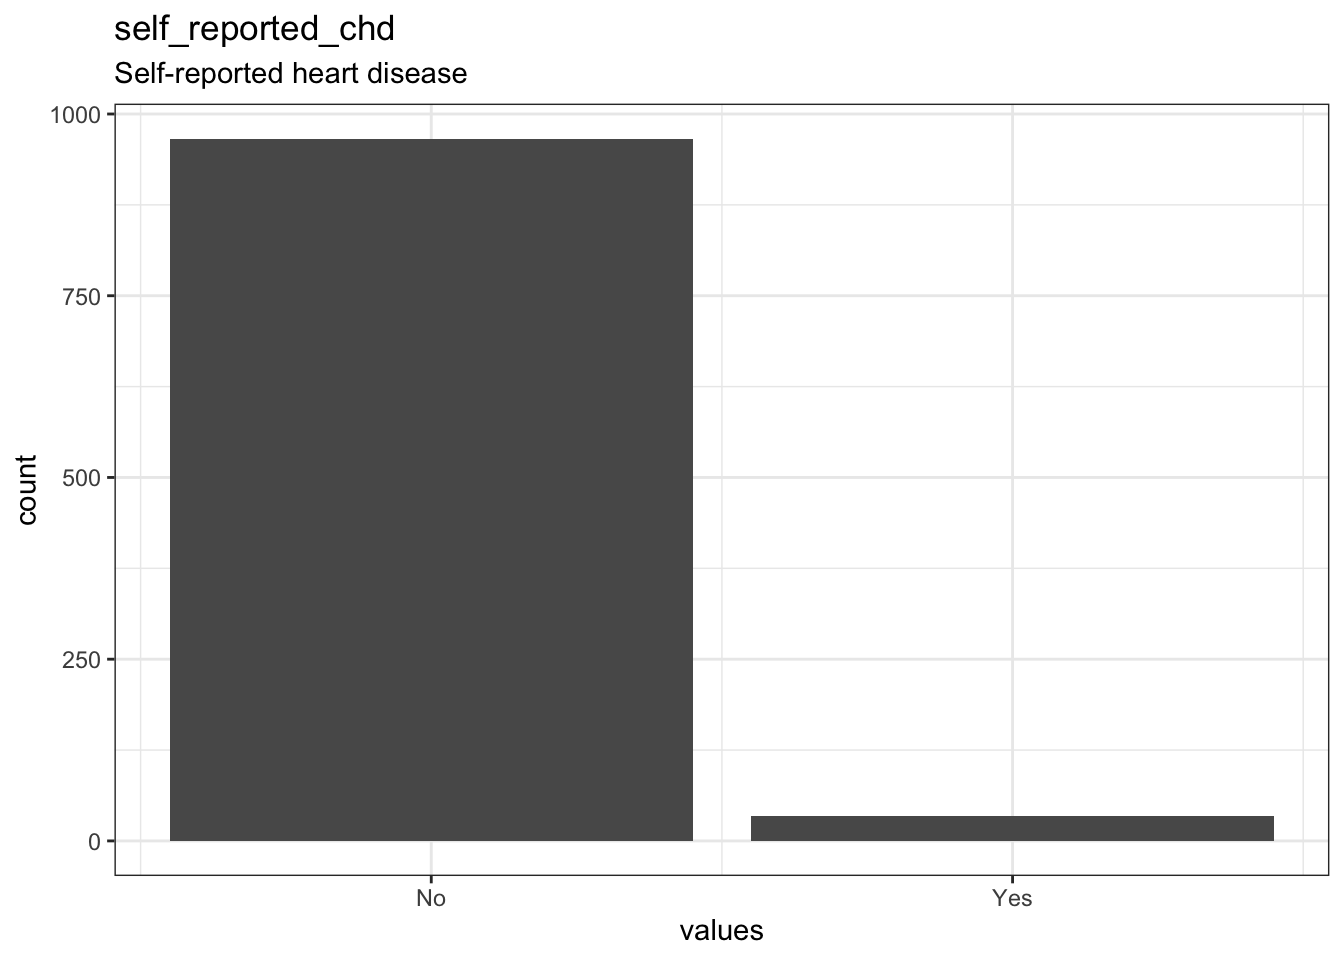
self_reported_chd
Self-reported heart disease
Distribution
0 missing values.
Summary statistics
| name | label | data_type | n_missing | complete_rate | min | median | max | mean | sd | n_value_labels | hist |
|---|---|---|---|---|---|---|---|---|---|---|---|
| self_reported_chd | Self-reported heart disease | haven_labelled | 0 | 1 | 0 | 0 | 1 | 0.034 | 0.1813198 | 2 | ▇▁▁▁▁▁▁▁ |
Value labels
| name | value |
|---|---|
| No | 0 |
| Yes | 1 |
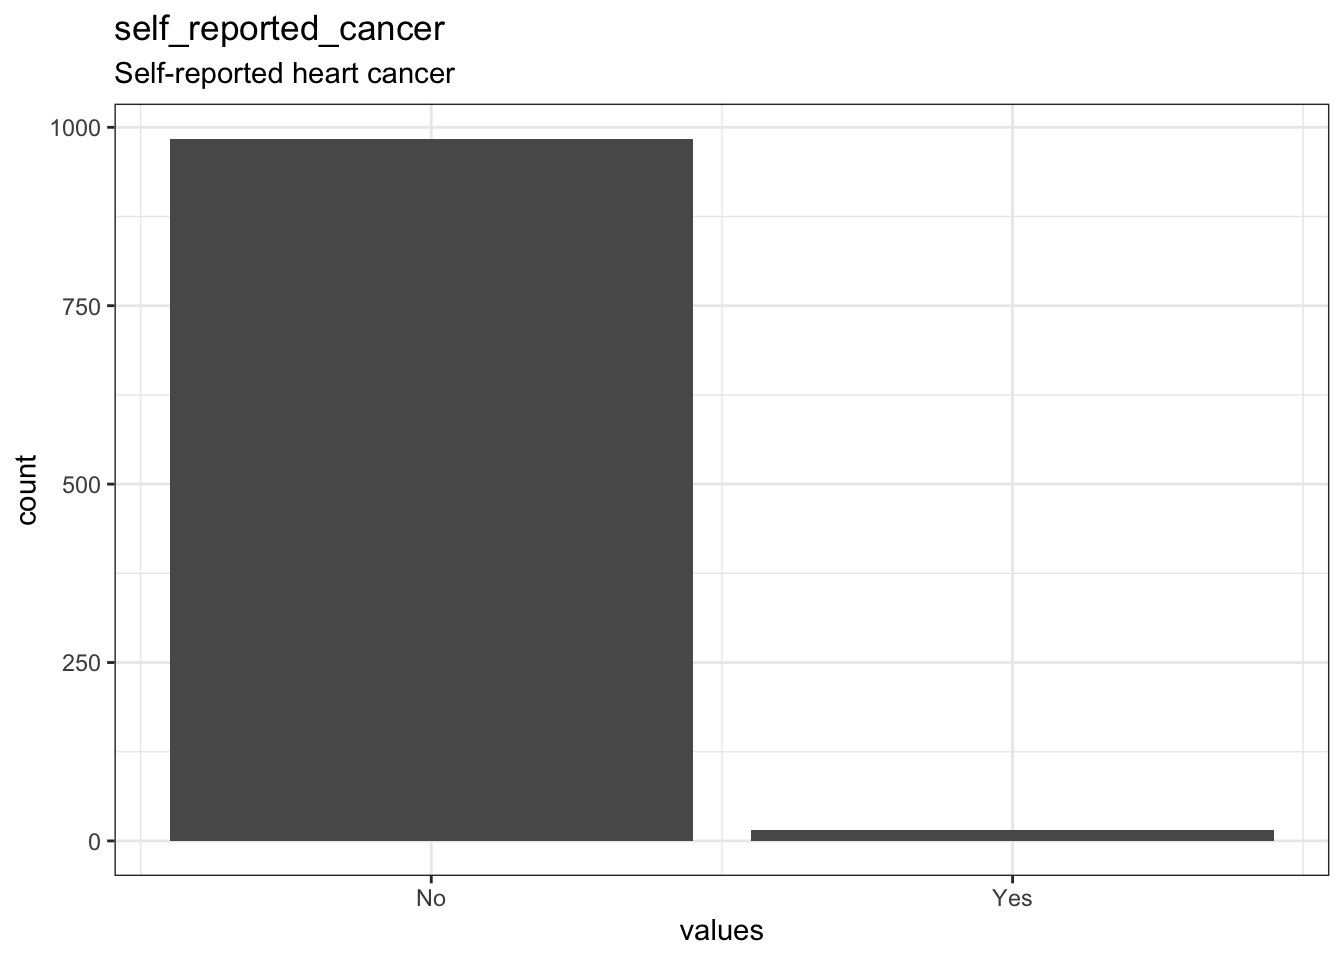
self_reported_cancer
Self-reported heart cancer
Distribution
1 missing values.
Summary statistics
| name | label | data_type | n_missing | complete_rate | min | median | max | mean | sd | n_value_labels | hist |
|---|---|---|---|---|---|---|---|---|---|---|---|
| self_reported_cancer | Self-reported heart cancer | haven_labelled | 1 | 0.999 | 0 | 0 | 1 | 0.015015 | 0.1216733 | 2 | ▇▁▁▁▁▁▁▁ |
Value labels
| name | value |
|---|---|
| No | 0 |
| Yes | 1 |
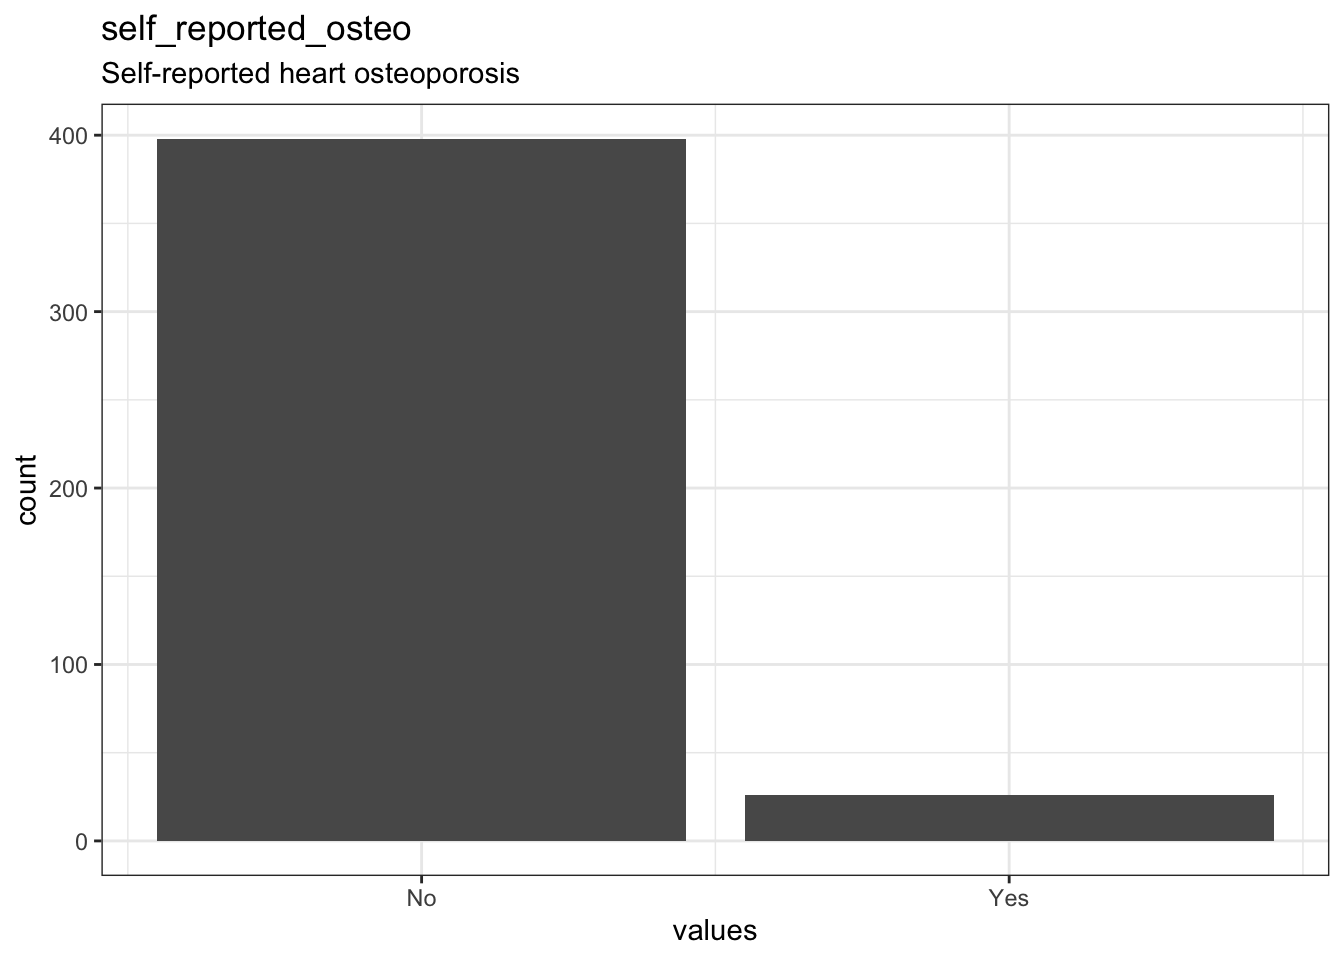
self_reported_osteo
Self-reported heart osteoporosis
Distribution
576 missing values.
Summary statistics
| name | label | data_type | n_missing | complete_rate | min | median | max | mean | sd | n_value_labels | hist |
|---|---|---|---|---|---|---|---|---|---|---|---|
| self_reported_osteo | Self-reported heart osteoporosis | haven_labelled | 576 | 0.424 | 0 | 0 | 1 | 0.0613208 | 0.2402012 | 2 | ▇▁▁▁▁▁▁▁ |
Value labels
| name | value |
|---|---|
| No | 0 |
| Yes | 1 |
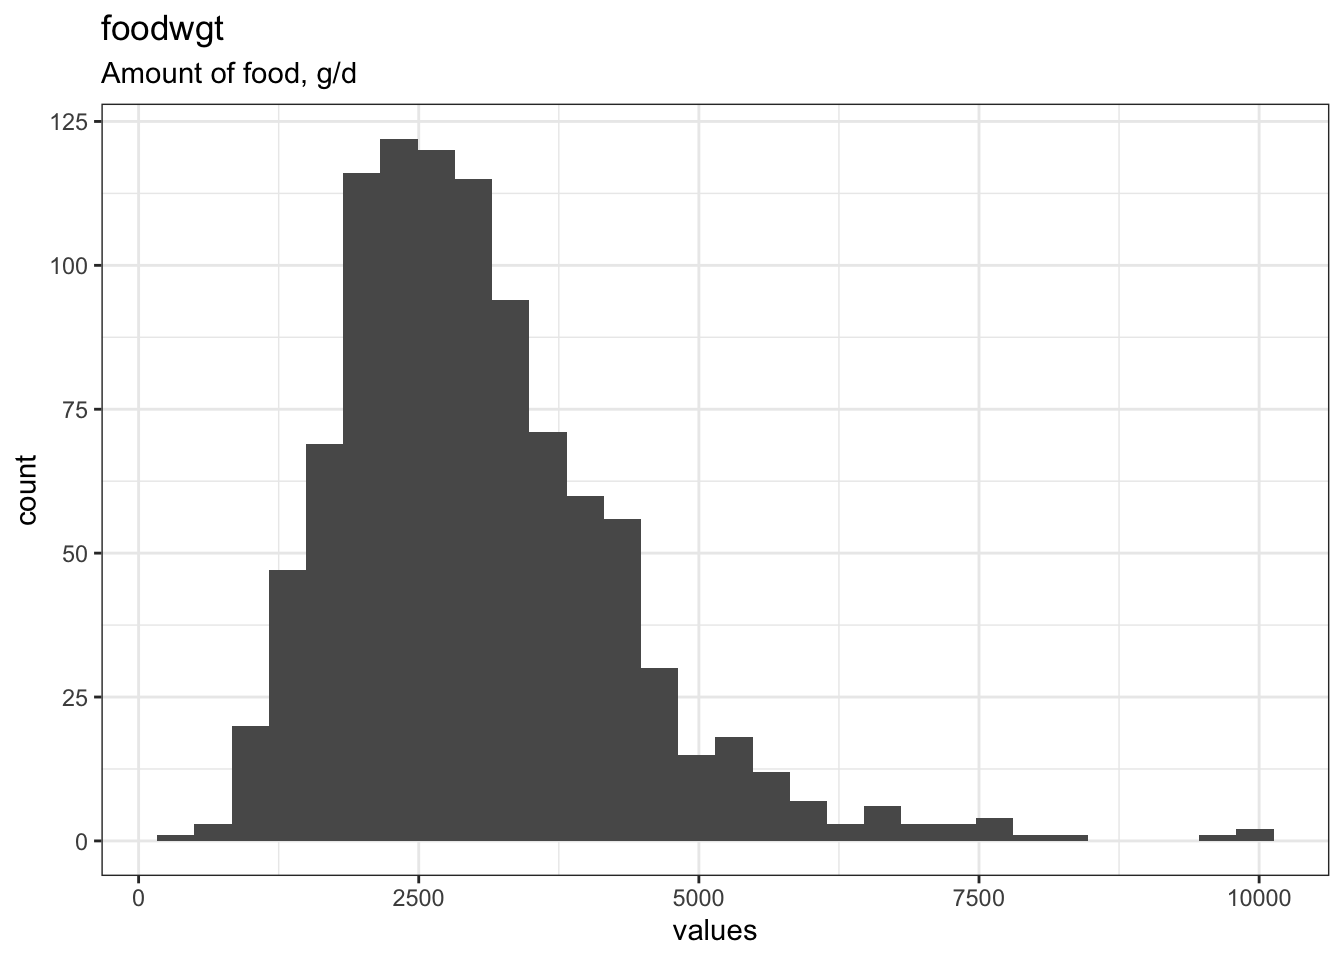
foodwgt
Amount of food, g/d
Distribution
0 missing values.
Summary statistics
| name | label | data_type | n_missing | complete_rate | min | median | max | mean | sd | hist |
|---|---|---|---|---|---|---|---|---|---|---|
| foodwgt | Amount of food, g/d | numeric | 0 | 1 | 440 | 2827 | 10071 | 3026.658 | 1268.366 | ▅▇▂▁▁ |
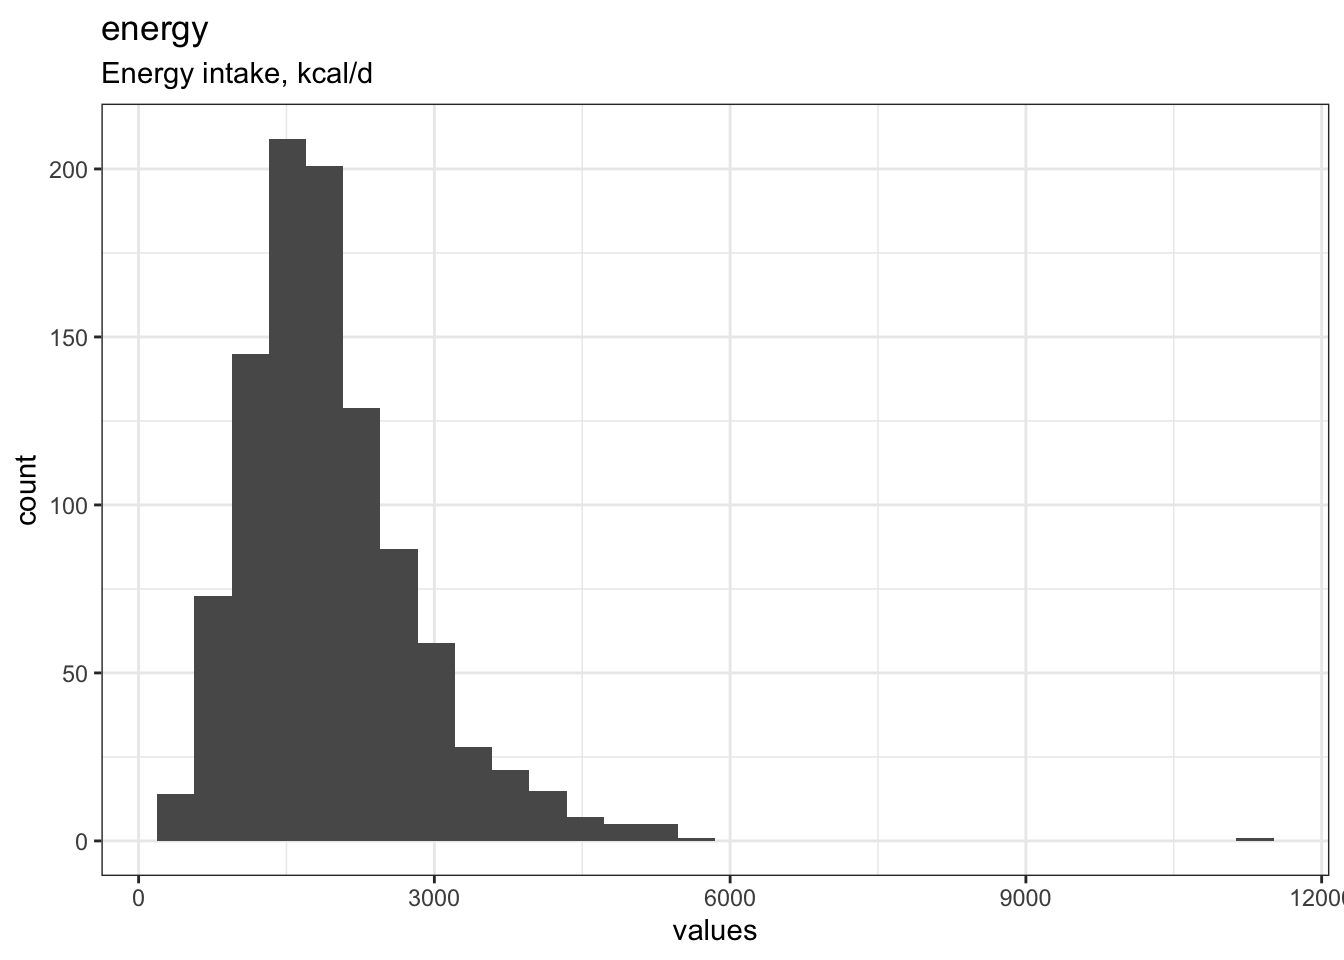
energy
Energy intake, kcal/d
Distribution
0 missing values.
Summary statistics
| name | label | data_type | n_missing | complete_rate | min | median | max | mean | sd | hist |
|---|---|---|---|---|---|---|---|---|---|---|
| energy | Energy intake, kcal/d | numeric | 0 | 1 | 210 | 1796 | 11156 | 1953.233 | 915.6632 | ▇▂▁▁▁ |
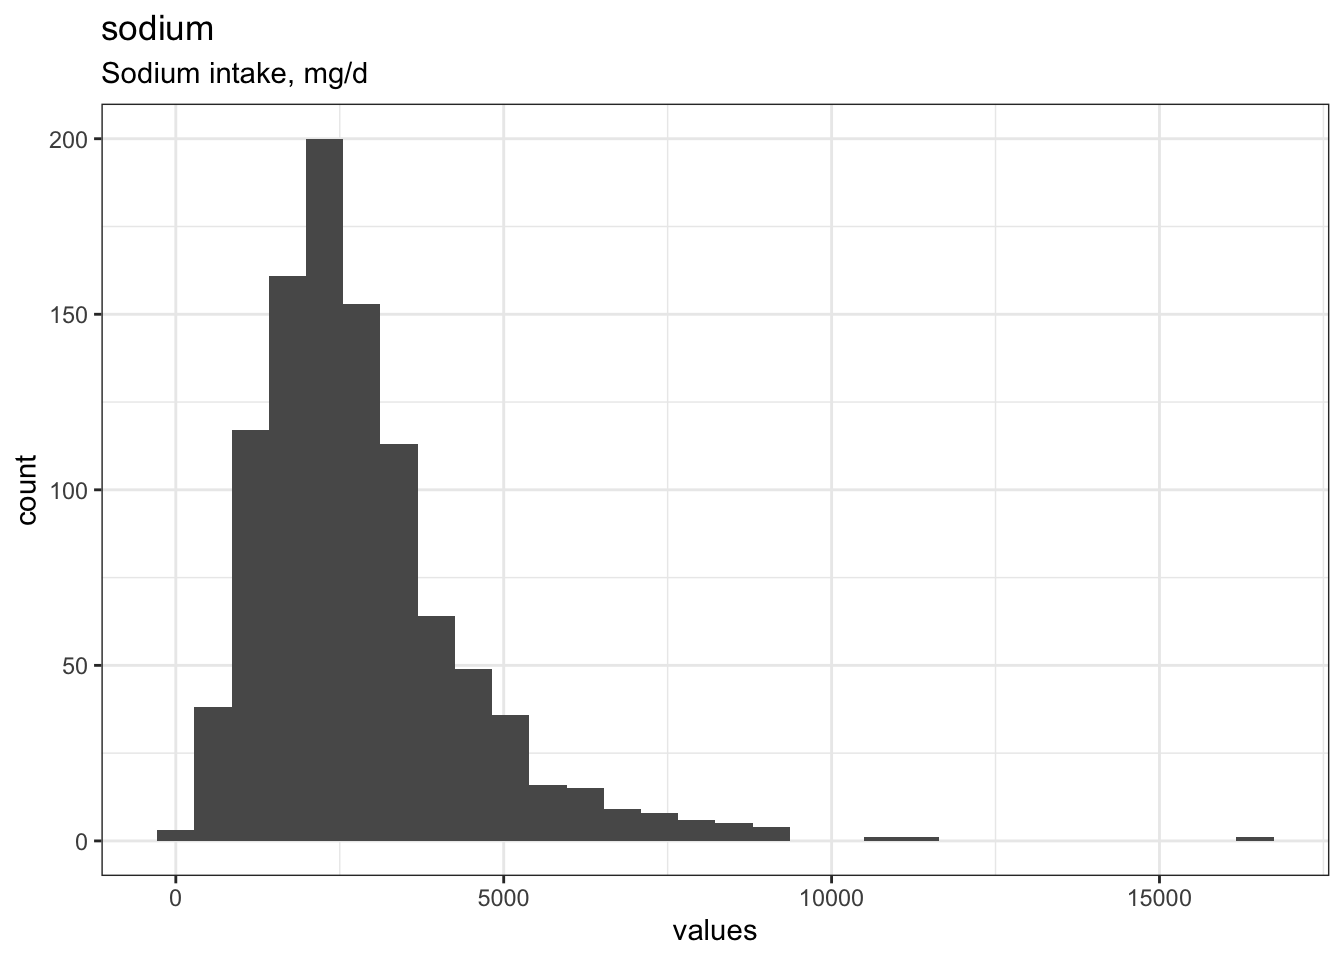
sodium
Sodium intake, mg/d
Distribution
0 missing values.
Summary statistics
| name | label | data_type | n_missing | complete_rate | min | median | max | mean | sd | hist |
|---|---|---|---|---|---|---|---|---|---|---|
| sodium | Sodium intake, mg/d | numeric | 0 | 1 | 34 | 2488 | 16490 | 2827.557 | 1640.5 | ▇▃▁▁▁ |
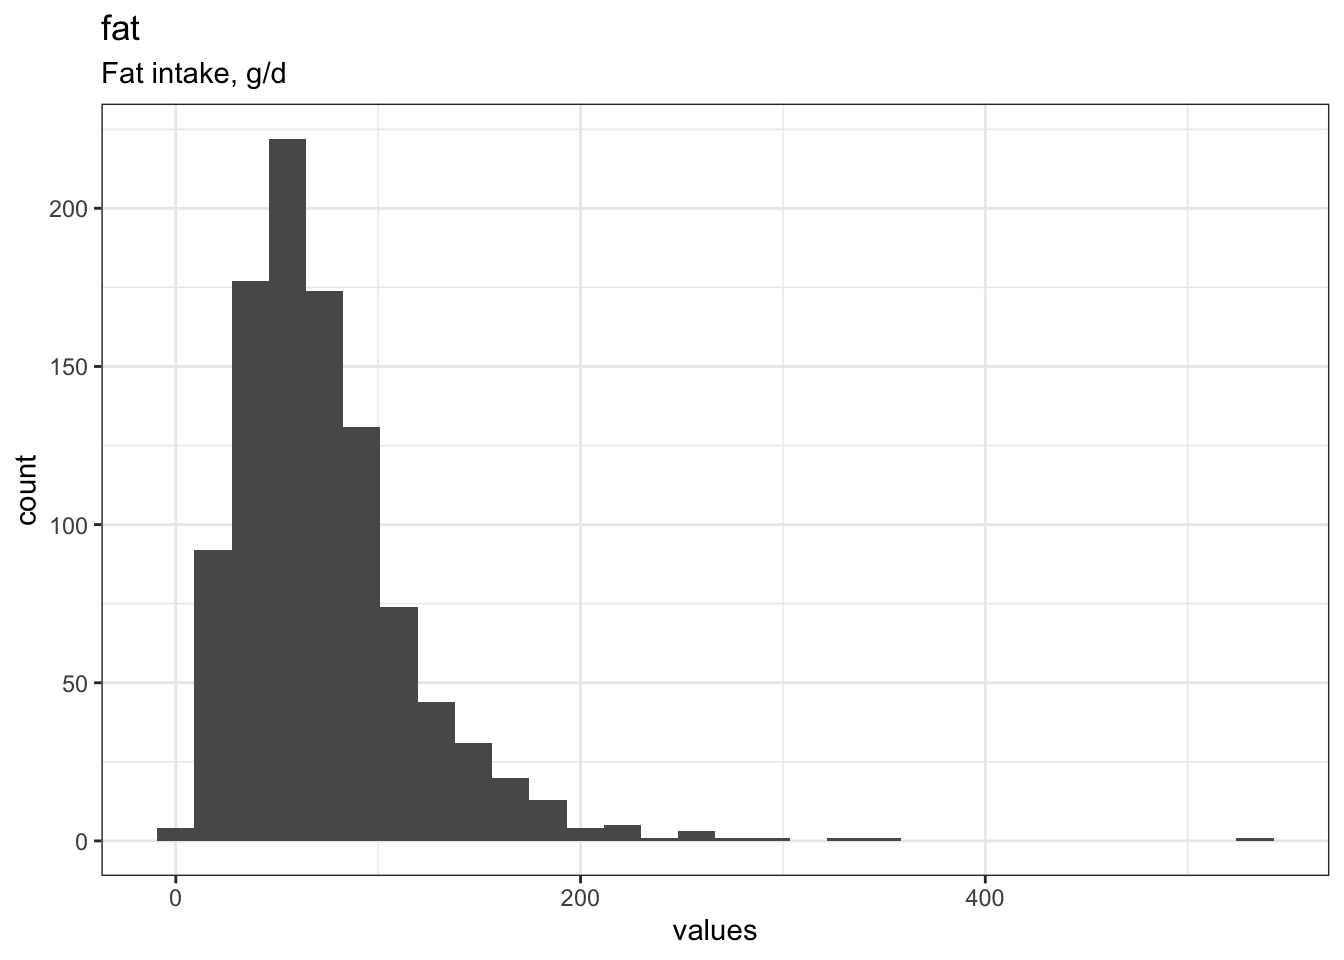
fat
Fat intake, g/d
Distribution
0 missing values.
Summary statistics
| name | label | data_type | n_missing | complete_rate | min | median | max | mean | sd | hist |
|---|---|---|---|---|---|---|---|---|---|---|
| fat | Fat intake, g/d | numeric | 0 | 1 | 1.3 | 65 | 535 | 73.80561 | 45.95376 | ▇▂▁▁▁ |
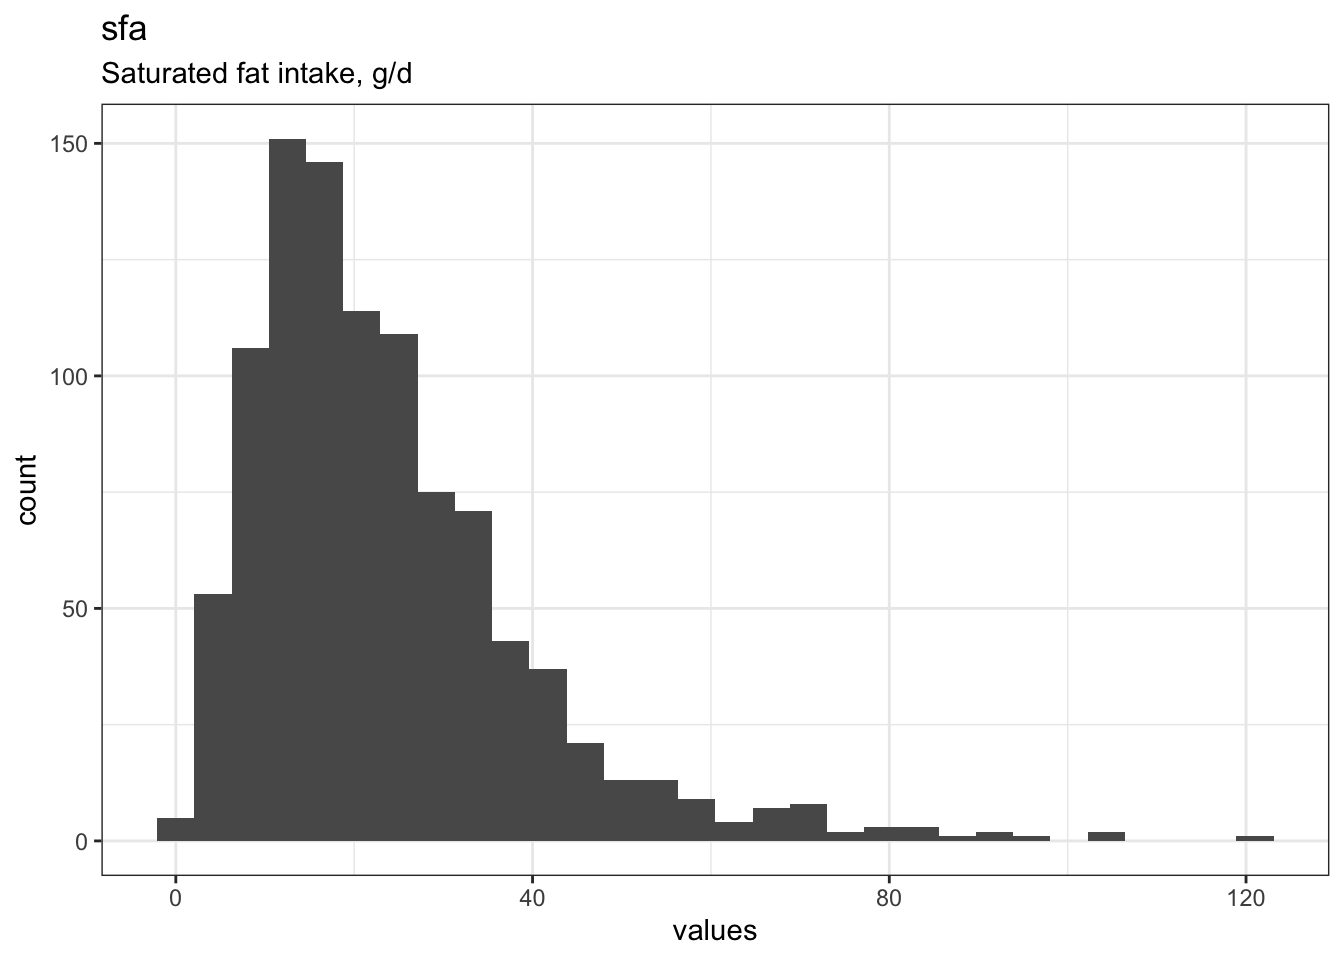
sfa
Saturated fat intake, g/d
Distribution
0 missing values.
Summary statistics
| name | label | data_type | n_missing | complete_rate | min | median | max | mean | sd | hist |
|---|---|---|---|---|---|---|---|---|---|---|
| sfa | Saturated fat intake, g/d | numeric | 0 | 1 | 0.34 | 20 | 121 | 23.66371 | 15.77335 | ▇▃▁▁▁ |
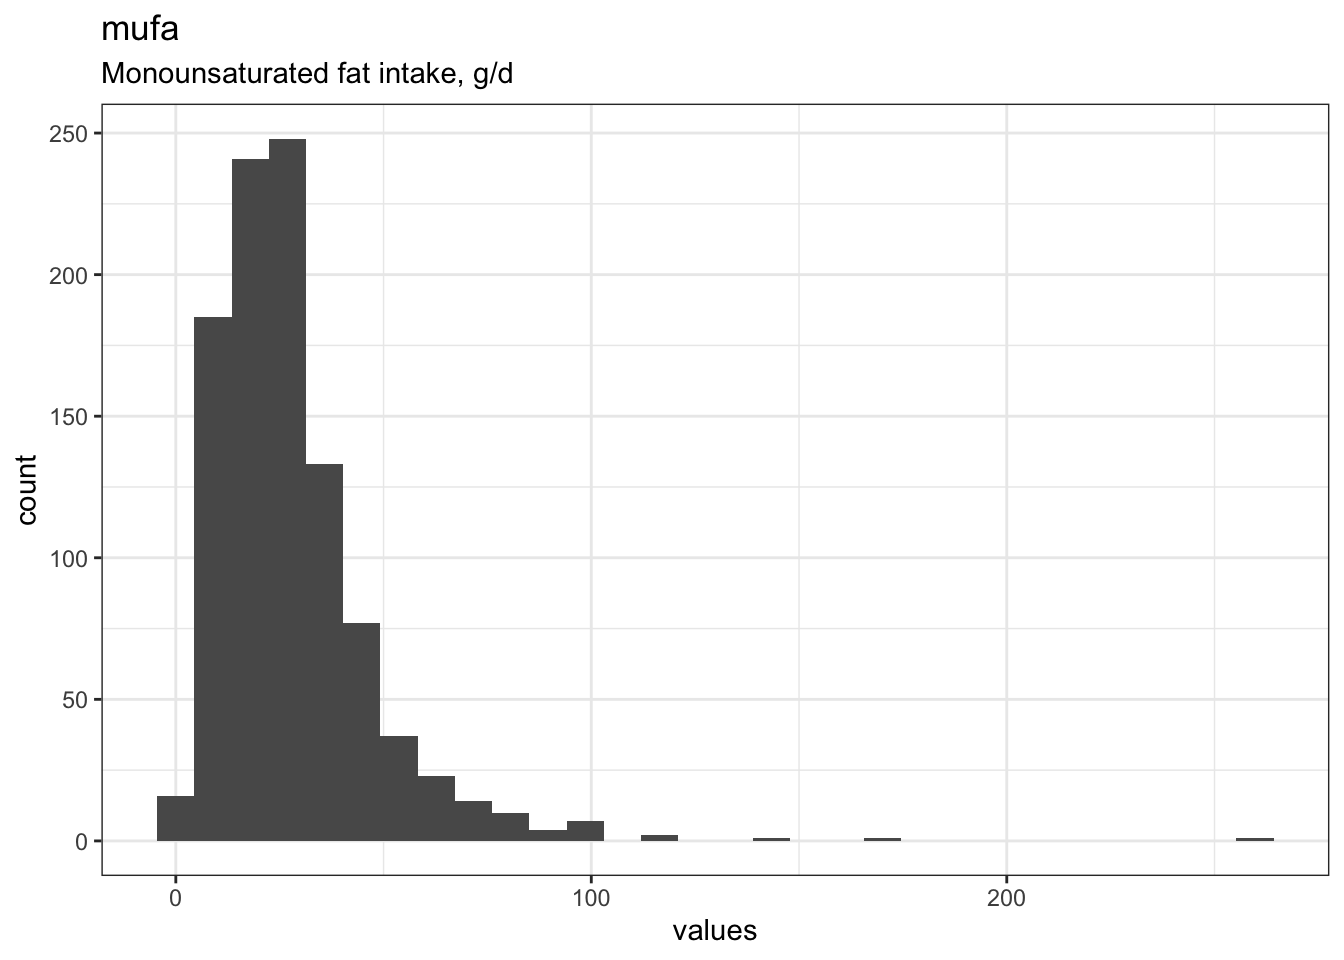
mufa
Monounsaturated fat intake, g/d
Distribution
0 missing values.
Summary statistics
| name | label | data_type | n_missing | complete_rate | min | median | max | mean | sd | hist |
|---|---|---|---|---|---|---|---|---|---|---|
| mufa | Monounsaturated fat intake, g/d | numeric | 0 | 1 | 0.43 | 24 | 260 | 27.80837 | 19.57877 | ▇▁▁▁▁ |
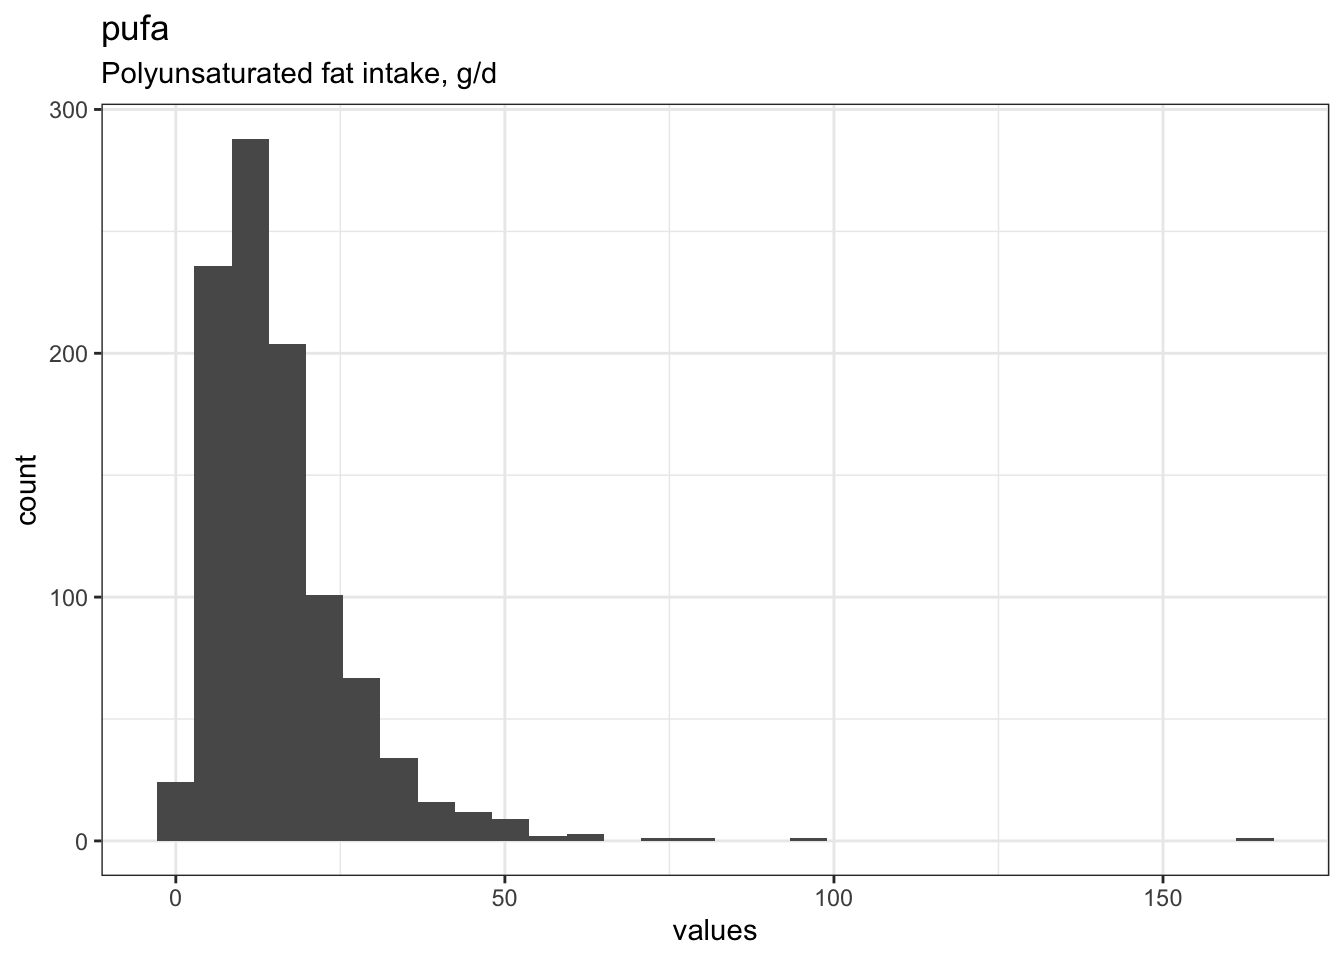
pufa
Polyunsaturated fat intake, g/d
Distribution
0 missing values.
Summary statistics
| name | label | data_type | n_missing | complete_rate | min | median | max | mean | sd | hist |
|---|---|---|---|---|---|---|---|---|---|---|
| pufa | Polyunsaturated fat intake, g/d | numeric | 0 | 1 | 0.22 | 13 | 164 | 15.71313 | 11.79504 | ▇▁▁▁▁ |
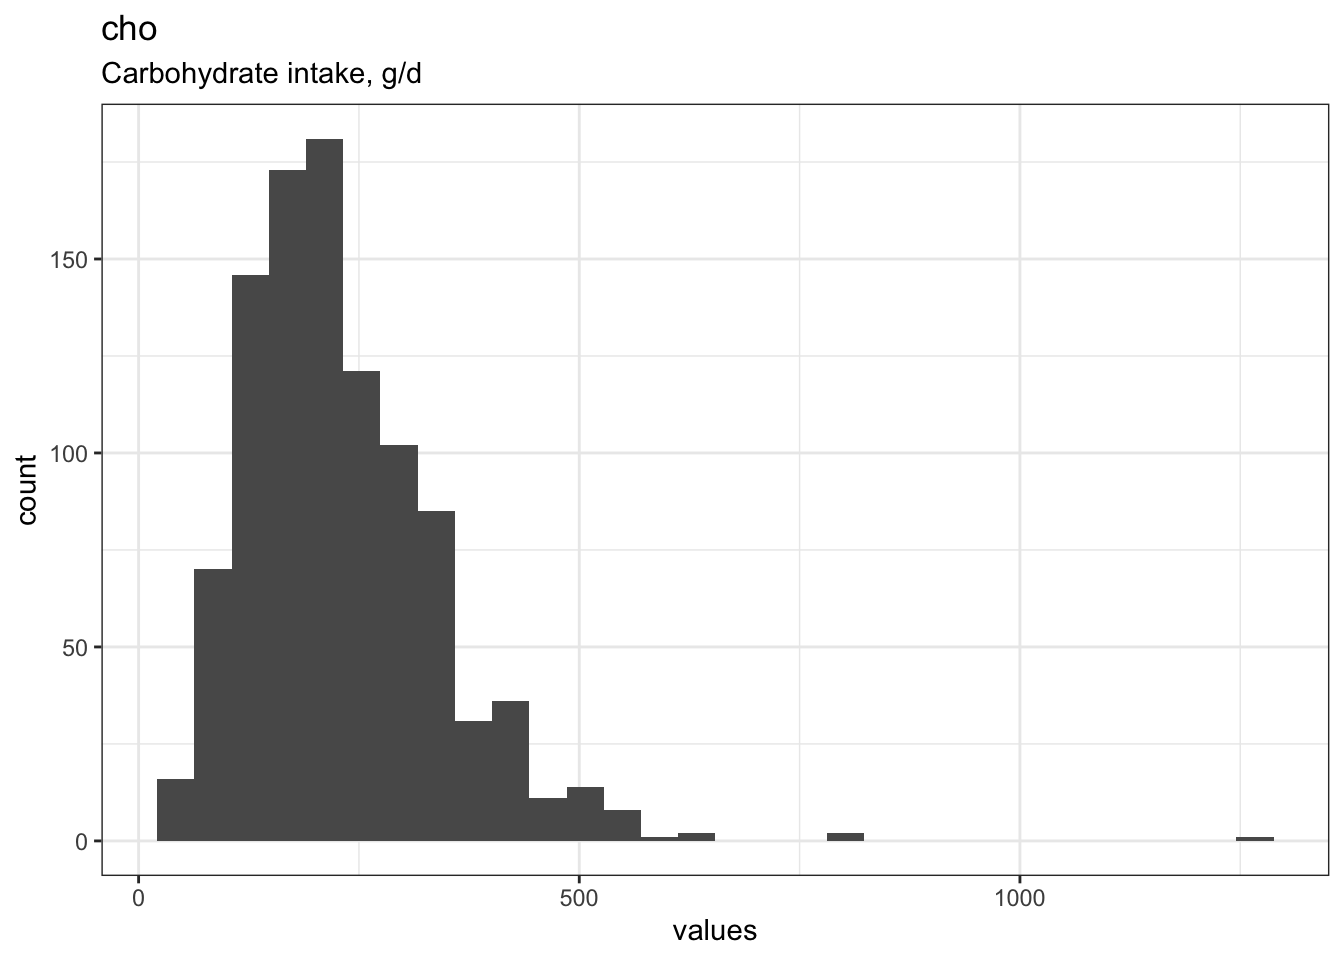
cho
Carbohydrate intake, g/d
Distribution
0 missing values.
Summary statistics
| name | label | data_type | n_missing | complete_rate | min | median | max | mean | sd | hist |
|---|---|---|---|---|---|---|---|---|---|---|
| cho | Carbohydrate intake, g/d | numeric | 0 | 1 | 25 | 211 | 1249 | 229.7135 | 110.5205 | ▇▃▁▁▁ |
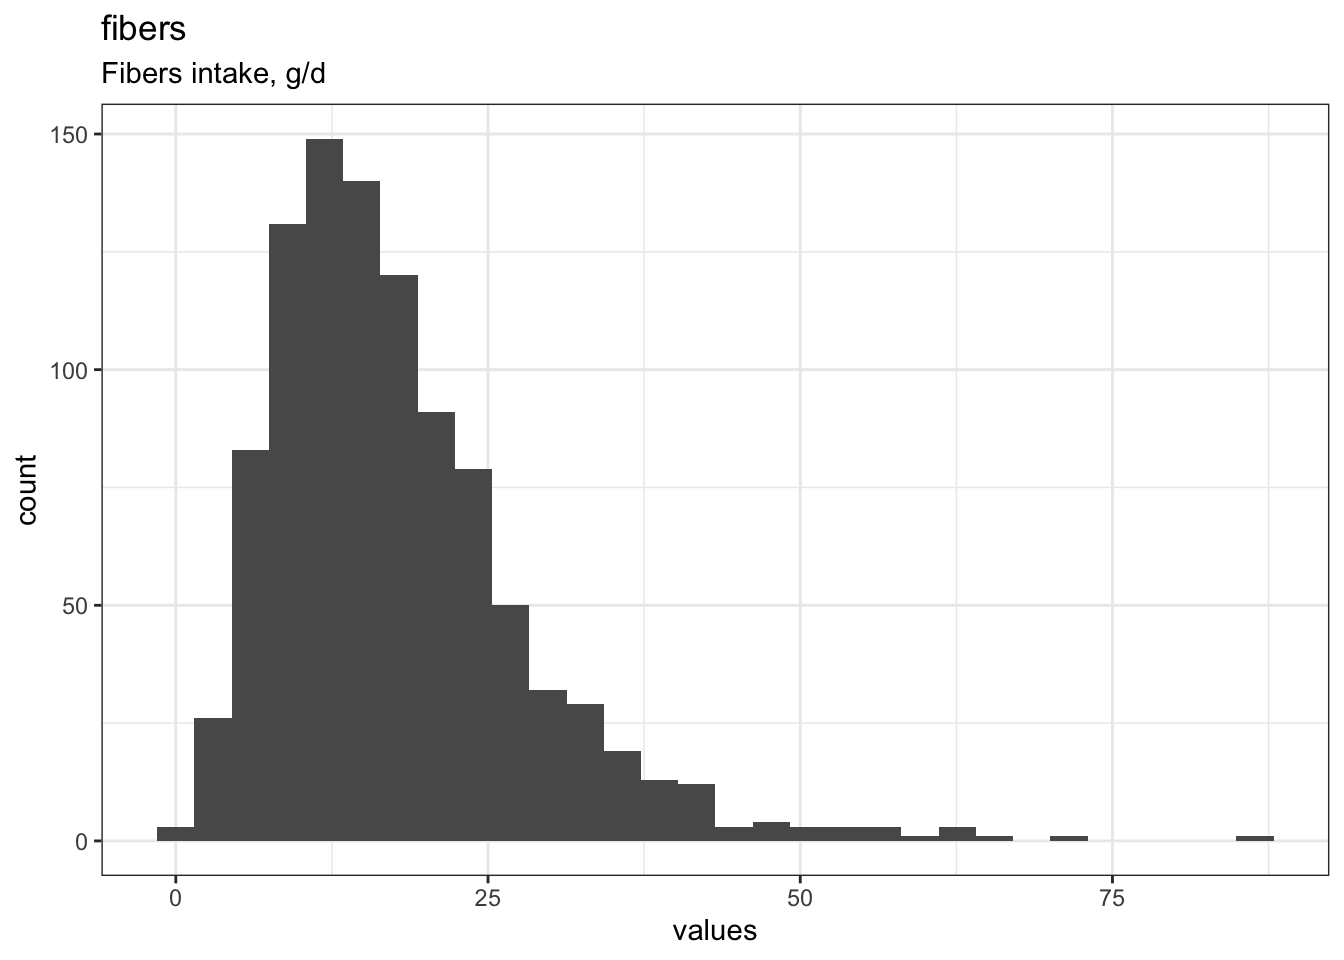
fibers
Fibers intake, g/d
Distribution
0 missing values.
Summary statistics
| name | label | data_type | n_missing | complete_rate | min | median | max | mean | sd | hist |
|---|---|---|---|---|---|---|---|---|---|---|
| fibers | Fibers intake, g/d | numeric | 0 | 1 | 0.13 | 16 | 87 | 17.7499 | 10.34278 | ▇▅▁▁▁ |
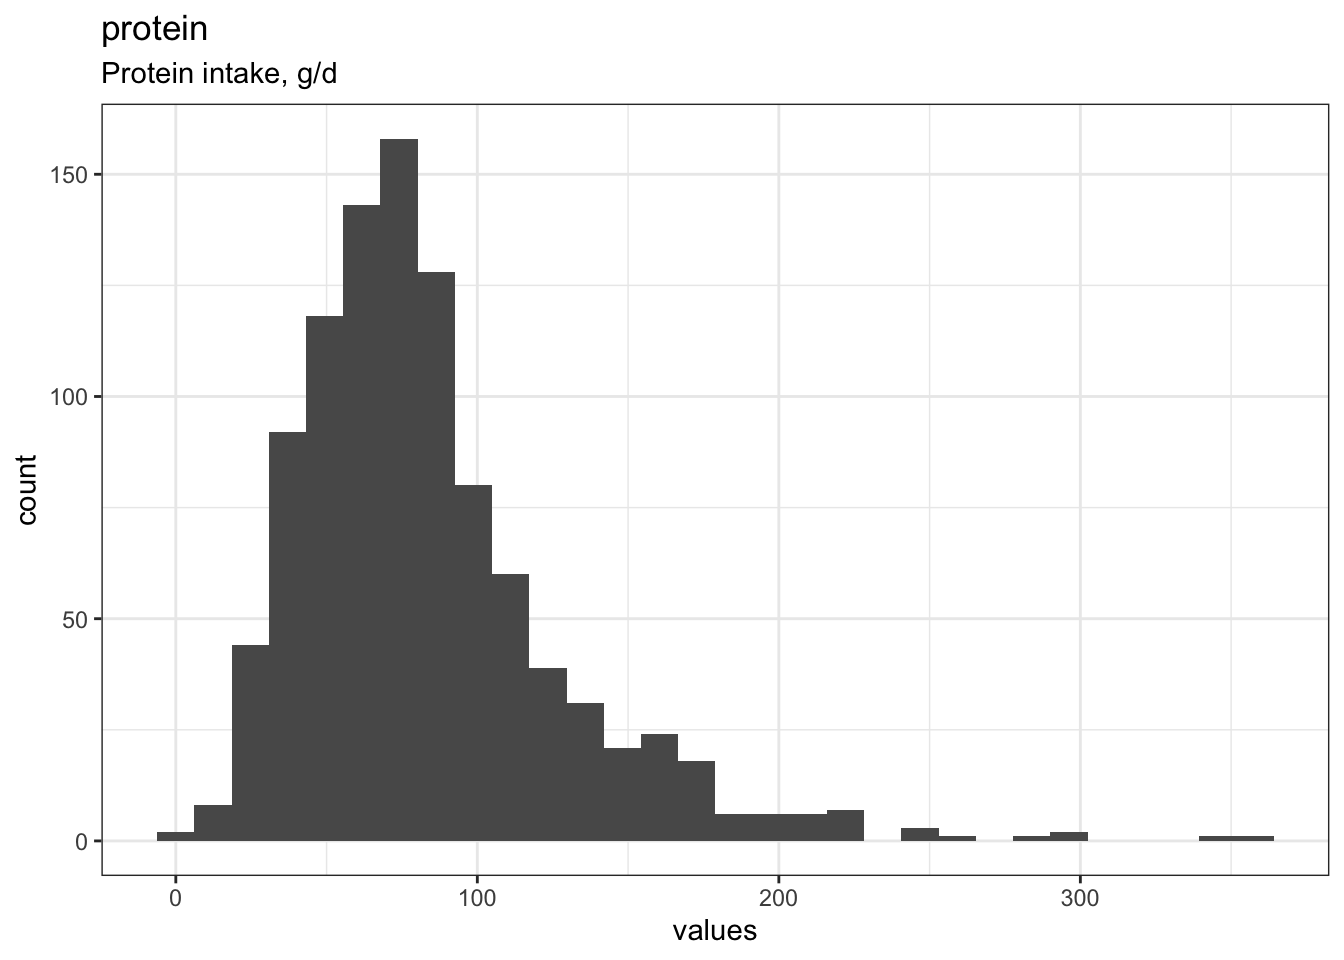
protein
Protein intake, g/d
Distribution
0 missing values.
Summary statistics
| name | label | data_type | n_missing | complete_rate | min | median | max | mean | sd | hist |
|---|---|---|---|---|---|---|---|---|---|---|
| protein | Protein intake, g/d | numeric | 0 | 1 | 3.9 | 75 | 362 | 83.18208 | 44.02892 | ▇▆▁▁▁ |
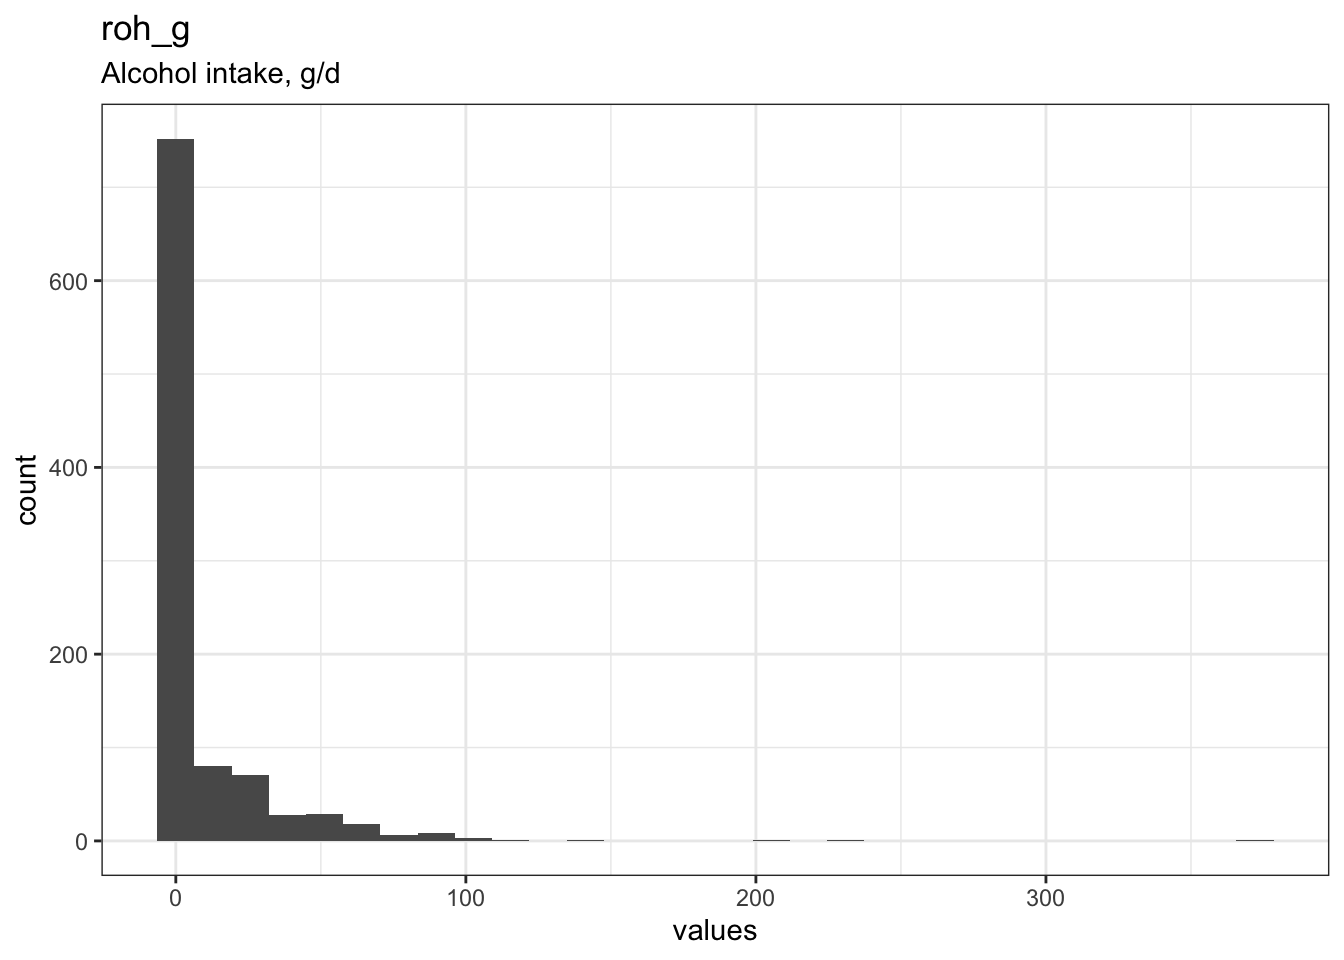
roh_g
Alcohol intake, g/d
Distribution
0 missing values.
Summary statistics
| name | label | data_type | n_missing | complete_rate | min | median | max | mean | sd | hist |
|---|---|---|---|---|---|---|---|---|---|---|
| roh_g | Alcohol intake, g/d | numeric | 0 | 1 | 0 | 0 | 372 | 9.299095 | 23.96846 | ▇▁▁▁▁ |
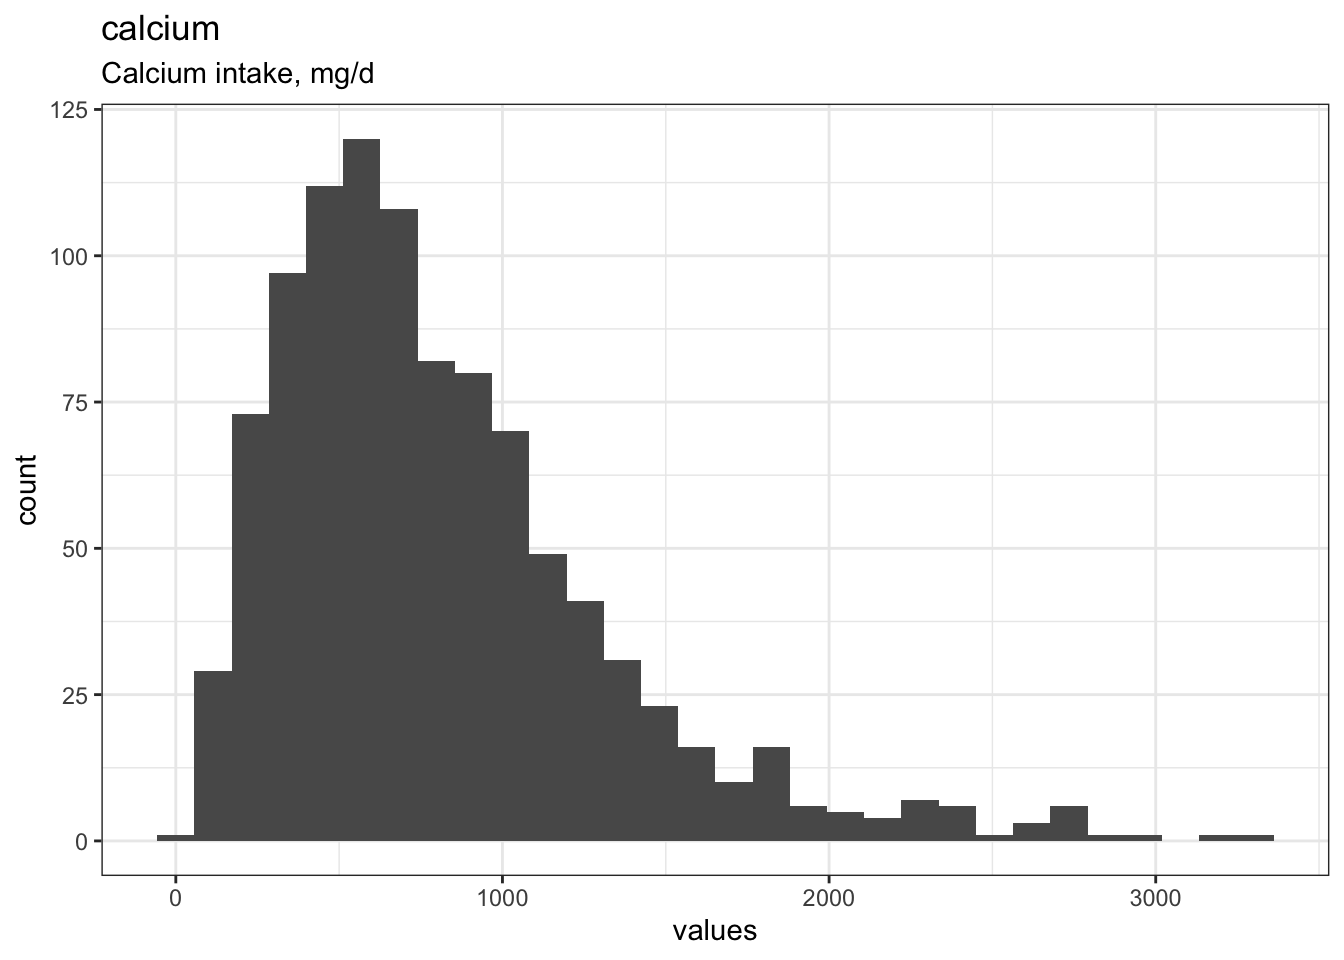
calcium
Calcium intake, mg/d
Distribution
0 missing values.
Summary statistics
| name | label | data_type | n_missing | complete_rate | min | median | max | mean | sd | hist |
|---|---|---|---|---|---|---|---|---|---|---|
| calcium | Calcium intake, mg/d | numeric | 0 | 1 | 12 | 695 | 3316 | 811.8428 | 513.2926 | ▇▆▂▁▁ |
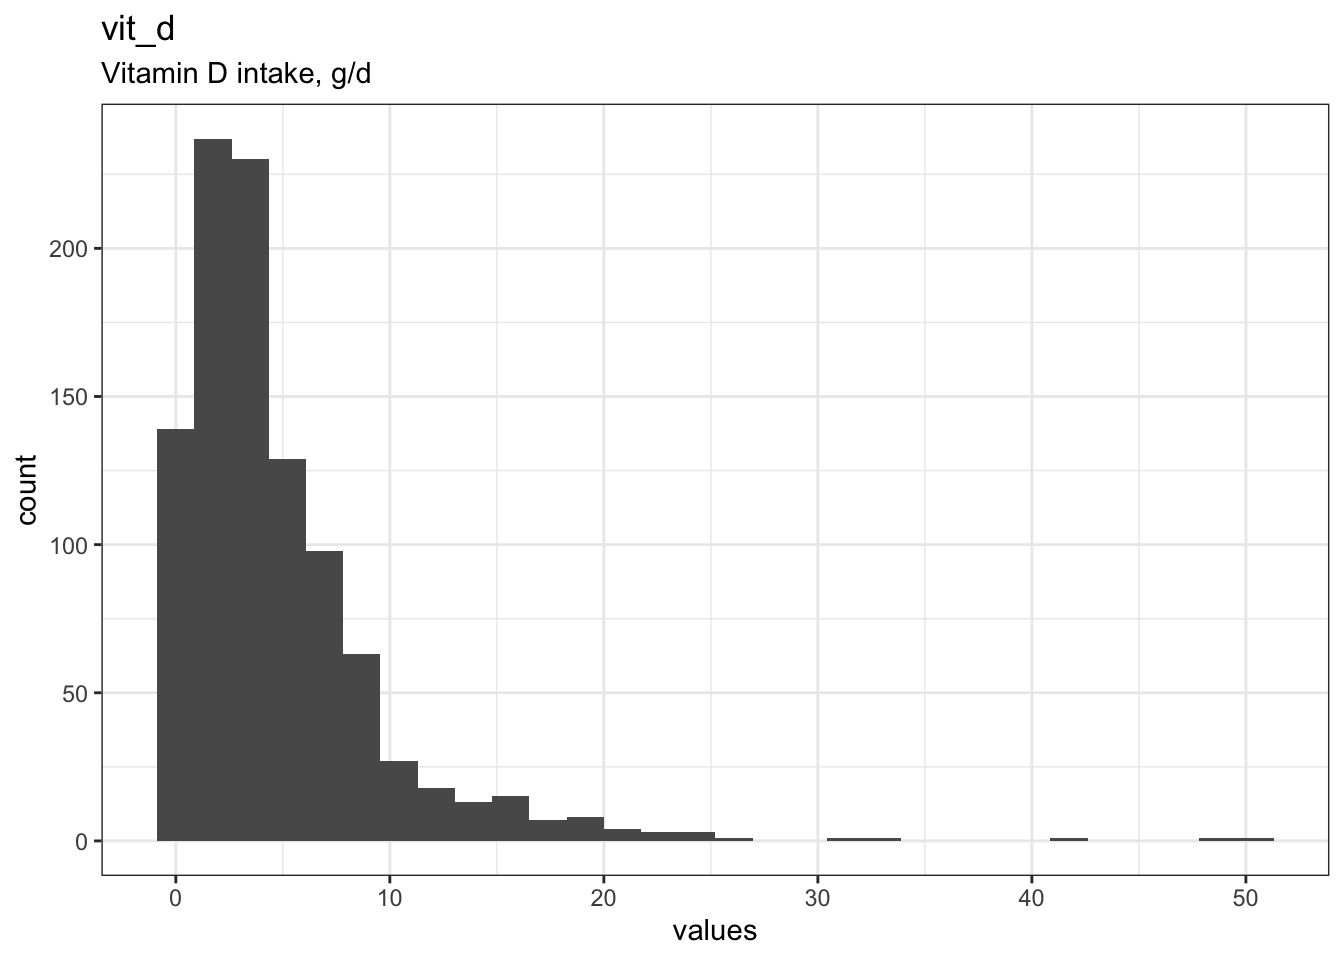
vit_d
Vitamin D intake, g/d
Distribution
0 missing values.
Summary statistics
| name | label | data_type | n_missing | complete_rate | min | median | max | mean | sd | hist |
|---|---|---|---|---|---|---|---|---|---|---|
| vit_d | Vitamin D intake, g/d | numeric | 0 | 1 | 0 | 3.3 | 50 | 4.763287 | 4.974068 | ▇▁▁▁▁ |
calcium_supp
Took a supplement containing calcium
Distribution
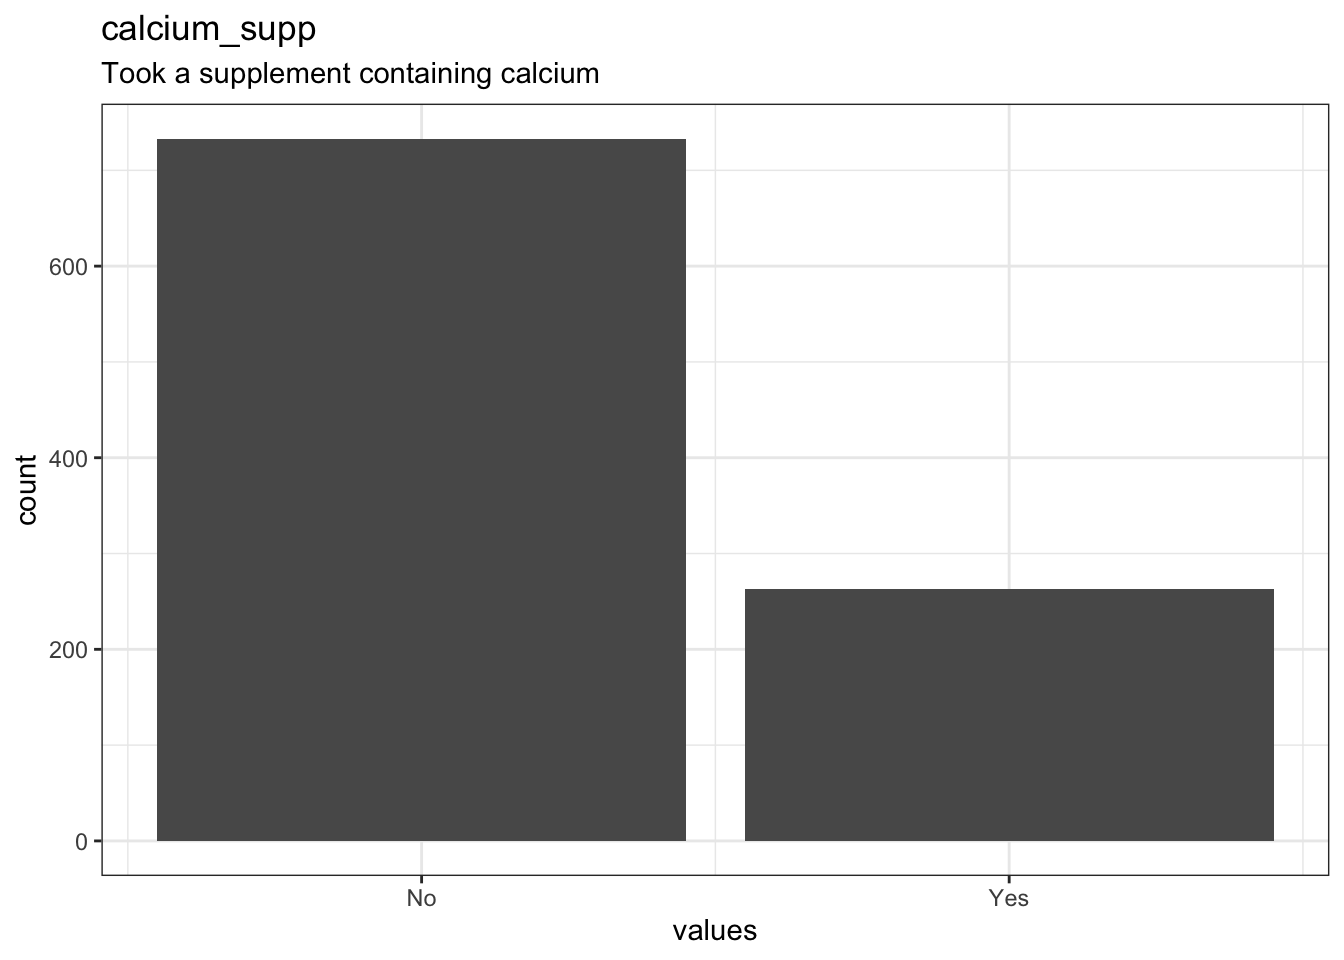
4 missing values.
Summary statistics
| name | label | data_type | n_missing | complete_rate | min | median | max | mean | sd | n_value_labels | hist |
|---|---|---|---|---|---|---|---|---|---|---|---|
| calcium_supp | Took a supplement containing calcium | haven_labelled | 4 | 0.996 | 0 | 0 | 1 | 0.2640562 | 0.4410508 | 2 | ▇▁▁▁▁▁▁▃ |
Value labels
| name | value |
|---|---|
| No | 0 |
| Yes | 1 |
vit_d_supp
Took a supplement containing vitamin D
Distribution
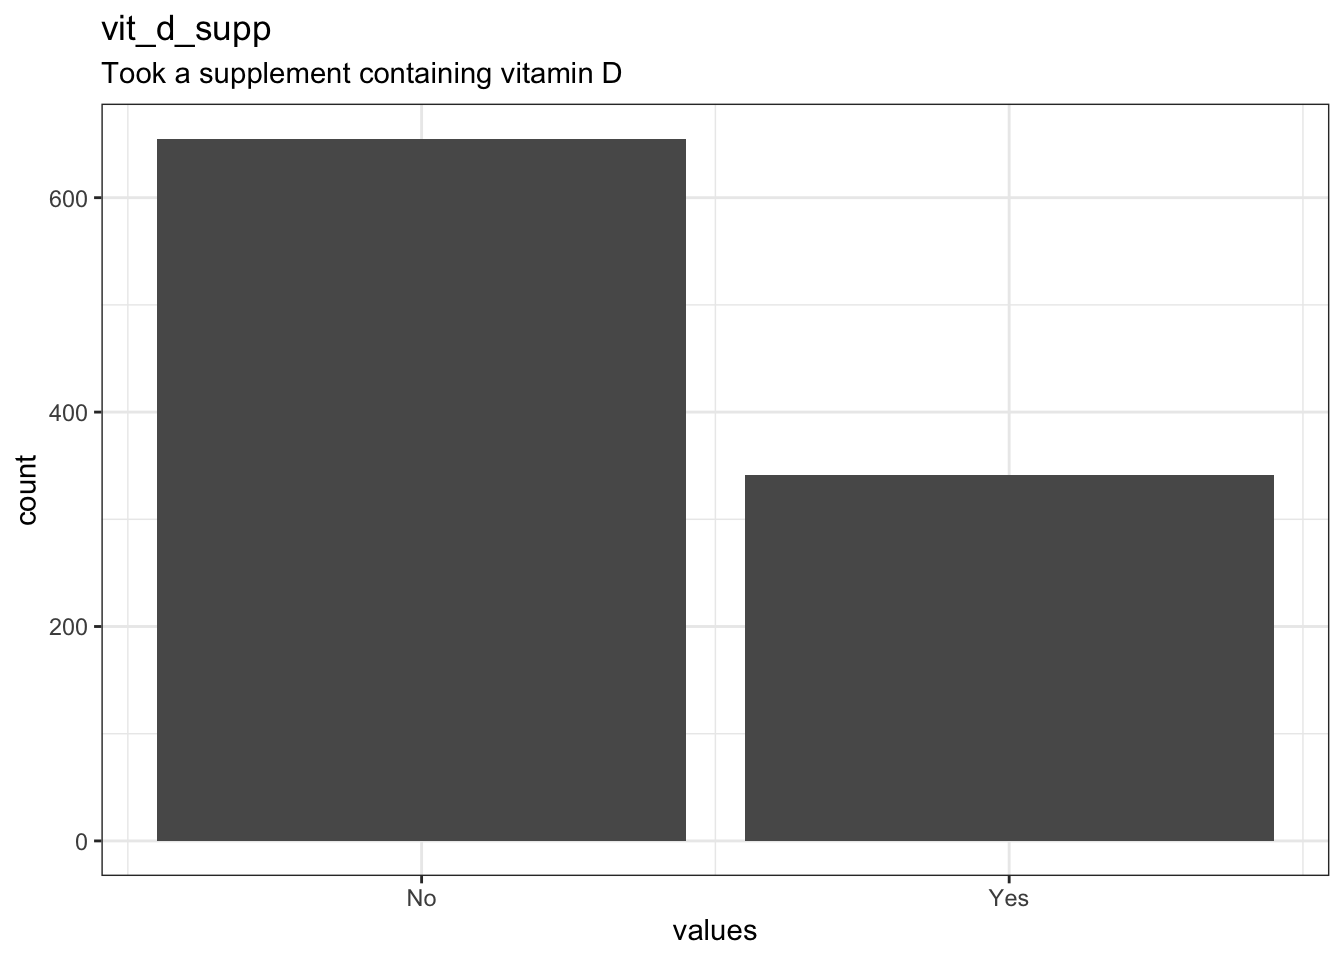
4 missing values.
Summary statistics
| name | label | data_type | n_missing | complete_rate | min | median | max | mean | sd | n_value_labels | hist |
|---|---|---|---|---|---|---|---|---|---|---|---|
| vit_d_supp | Took a supplement containing vitamin D | haven_labelled | 4 | 0.996 | 0 | 0 | 1 | 0.3423695 | 0.4747409 | 2 | ▇▁▁▁▁▁▁▅ |
Value labels
| name | value |
|---|---|
| No | 0 |
| Yes | 1 |
Missingness report
Codebook table
JSON-LD metadata
The following JSON-LD can be found by search engines, if you share this codebook publicly on the web.
{
  "name": "Demonstration data based on the CCHS 2015 - Nutrition",
  "description": "Sample of 1,000 respondents aged 19-70 y selected proportionally to sampling weights from the CCHS 2015 - Nutrition (PUMF)\n\n\n## Table of variables\nThis table contains variable names, labels, and number of missing values.\nSee the complete codebook for more.\n\n|name                 |label                                              | n_missing|\n|:--------------------|:--------------------------------------------------|---------:|\n|participantid        |Unique identifier                                  |         0|\n|r24_season           |Season (24-h dietary recall)                       |         0|\n|r24_weekend          |Weekend (24-h dietary recall)                      |         0|\n|r24_nfoods           |Number of items reported (24-h dietary recall)     |         0|\n|province             |Province of residence                              |         0|\n|age                  |Age, years                                         |         0|\n|sex                  |Sex                                                |         0|\n|drig                 |Dietary Reference Intake age/sex group             |         0|\n|education            |Education level                                    |        10|\n|income               |Total household income                             |         1|\n|marital_status       |Marital status                                     |         6|\n|smoking              |Smoking status                                     |         0|\n|phys_act_mod         |Moderate or vigorous physical activity, hours/week |         2|\n|food_security        |Household Food Security Status                     |         2|\n|bodyweight           |Bodyweight, kg                                     |       284|\n|height               |Height, meters                                     |       313|\n|bmi                  |Body mass index, kg/m2                             |       356|\n|self_rated_health    |Self-rated health                                  |         1|\n|self_reported_bp     |Self-reported high blood pressure                  |         2|\n|self_reported_db     |Self-reported diabetes                             |         0|\n|self_reported_chd    |Self-reported heart disease                        |         0|\n|self_reported_cancer |Self-reported heart cancer                         |         1|\n|self_reported_osteo  |Self-reported heart osteoporosis                   |       576|\n|foodwgt              |Amount of food, g/d                                |         0|\n|energy               |Energy intake, kcal/d                              |         0|\n|sodium               |Sodium intake, mg/d                                |         0|\n|fat                  |Fat intake, g/d                                    |         0|\n|sfa                  |Saturated fat intake, g/d                          |         0|\n|mufa                 |Monounsaturated fat intake, g/d                    |         0|\n|pufa                 |Polyunsaturated fat intake, g/d                    |         0|\n|cho                  |Carbohydrate intake, g/d                           |         0|\n|fibers               |Fibers intake, g/d                                 |         0|\n|protein              |Protein intake, g/d                                |         0|\n|roh_g                |Alcohol intake, g/d                                |         0|\n|calcium              |Calcium intake, mg/d                               |         0|\n|vit_d                |Vitamin D intake, g/d                              |         0|\n|calcium_supp         |Took a supplement containing calcium               |         4|\n|vit_d_supp           |Took a supplement containing vitamin D             |         4|\n\n### Note\nThis dataset was automatically described using the [codebook R package](https://rubenarslan.github.io/codebook/) (version 0.9.2).",
  "citation": "Adapted from Statistics Canada, Canadian Community Health Survey - Nutrition: Public Use Microdata File, 2015, April 2023. This does not constitute an endorsement by Statistics Canada of this product.",
  "temporalCoverage": "2015",
  "spatialCoverage": "Canada",
  "datePublished": "2018-12-21",
  "url": "https://www150.statcan.gc.ca/n1/en/catalogue/82M0024X2018001",
  "keywords": ["participantid", "r24_season", "r24_weekend", "r24_nfoods", "province", "age", "sex", "drig", "education", "income", "marital_status", "smoking", "phys_act_mod", "food_security", "bodyweight", "height", "bmi", "self_rated_health", "self_reported_bp", "self_reported_db", "self_reported_chd", "self_reported_cancer", "self_reported_osteo", "foodwgt", "energy", "sodium", "fat", "sfa", "mufa", "pufa", "cho", "fibers", "protein", "roh_g", "calcium", "vit_d", "calcium_supp", "vit_d_supp"],
  "@context": "http://schema.org/",
  "@type": "Dataset",
  "variableMeasured": [
    {
      "name": "participantid",
      "description": "Unique identifier",
      "@type": "propertyValue"
    },
    {
      "name": "r24_season",
      "description": "Season (24-h dietary recall)",
      "@type": "propertyValue"
    },
    {
      "name": "r24_weekend",
      "description": "Weekend (24-h dietary recall)",
      "value": "0. Weekday,\n1. Weekend",
      "maxValue": 1,
      "minValue": 0,
      "@type": "propertyValue"
    },
    {
      "name": "r24_nfoods",
      "description": "Number of items reported (24-h dietary recall)",
      "@type": "propertyValue"
    },
    {
      "name": "province",
      "description": "Province of residence",
      "value": "1. Newfoundland and Labrador,\n2. Prince Edward Island,\n3. Nova Scotia,\n4. New Brunswick,\n5. Quebec,\n6. Ontario,\n7. Manitoba,\n8. Saskatchewan,\n9. Alberta,\n10. British Columbia",
      "@type": "propertyValue"
    },
    {
      "name": "age",
      "description": "Age, years",
      "@type": "propertyValue"
    },
    {
      "name": "sex",
      "description": "Sex",
      "value": "1. Male,\n2. Female",
      "@type": "propertyValue"
    },
    {
      "name": "drig",
      "description": "Dietary Reference Intake age/sex group",
      "value": "8. Male, 19 to 30 y,\n9. Female, 19 to 30 y,\n10. Male, 31 to 50 y,\n11. Female, 31 to 50 y,\n12. Male, 51 to 70 y,\n13. Female, 51 to 70 y",
      "maxValue": 13,
      "minValue": 8,
      "@type": "propertyValue"
    },
    {
      "name": "education",
      "description": "Education level",
      "value": "1. Less than high school,\n2. High school,\n3. Trade diploma/College,\n4. University",
      "maxValue": 4,
      "minValue": 1,
      "@type": "propertyValue"
    },
    {
      "name": "income",
      "description": "Total household income",
      "value": "1. <20,000,\n2. 20,000 to <40,000,\n3. 40,000 to <60,000,\n4. 60,000 to <80,000,\n5. 80,000 to <100,000,\n6. 100,000 to <120,000,\n7. 120,000 to <140,000,\n8. 140,000 or more",
      "maxValue": 8,
      "minValue": 1,
      "@type": "propertyValue"
    },
    {
      "name": "marital_status",
      "description": "Marital status",
      "value": "1. Married,\n2. Living common-law,\n3. Widowed/Divorced/Separated,\n4. Single, never married",
      "@type": "propertyValue"
    },
    {
      "name": "smoking",
      "description": "Smoking status",
      "value": "0. Not smoking,\n1. Occasionally,\n2. Daily",
      "maxValue": 2,
      "minValue": 0,
      "@type": "propertyValue"
    },
    {
      "name": "phys_act_mod",
      "description": "Moderate or vigorous physical activity, hours/week",
      "@type": "propertyValue"
    },
    {
      "name": "food_security",
      "description": "Household Food Security Status",
      "value": "0. Food secure,\n1. Moderately food insecure,\n2. Severely food insecure",
      "maxValue": 2,
      "minValue": 0,
      "@type": "propertyValue"
    },
    {
      "name": "bodyweight",
      "description": "Bodyweight, kg",
      "@type": "propertyValue"
    },
    {
      "name": "height",
      "description": "Height, meters",
      "@type": "propertyValue"
    },
    {
      "name": "bmi",
      "description": "Body mass index, kg/m2",
      "@type": "propertyValue"
    },
    {
      "name": "self_rated_health",
      "description": "Self-rated health",
      "value": "0. Poor,\n1. Fair,\n2. Good,\n3. Very good,\n4. Excellent",
      "maxValue": 4,
      "minValue": 0,
      "@type": "propertyValue"
    },
    {
      "name": "self_reported_bp",
      "description": "Self-reported high blood pressure",
      "value": "0. No,\n1. Yes",
      "maxValue": 1,
      "minValue": 0,
      "@type": "propertyValue"
    },
    {
      "name": "self_reported_db",
      "description": "Self-reported diabetes",
      "value": "0. No,\n1. Yes",
      "maxValue": 1,
      "minValue": 0,
      "@type": "propertyValue"
    },
    {
      "name": "self_reported_chd",
      "description": "Self-reported heart disease",
      "value": "0. No,\n1. Yes",
      "maxValue": 1,
      "minValue": 0,
      "@type": "propertyValue"
    },
    {
      "name": "self_reported_cancer",
      "description": "Self-reported heart cancer",
      "value": "0. No,\n1. Yes",
      "maxValue": 1,
      "minValue": 0,
      "@type": "propertyValue"
    },
    {
      "name": "self_reported_osteo",
      "description": "Self-reported heart osteoporosis",
      "value": "0. No,\n1. Yes",
      "maxValue": 1,
      "minValue": 0,
      "@type": "propertyValue"
    },
    {
      "name": "foodwgt",
      "description": "Amount of food, g/d",
      "@type": "propertyValue"
    },
    {
      "name": "energy",
      "description": "Energy intake, kcal/d",
      "@type": "propertyValue"
    },
    {
      "name": "sodium",
      "description": "Sodium intake, mg/d",
      "@type": "propertyValue"
    },
    {
      "name": "fat",
      "description": "Fat intake, g/d",
      "@type": "propertyValue"
    },
    {
      "name": "sfa",
      "description": "Saturated fat intake, g/d",
      "@type": "propertyValue"
    },
    {
      "name": "mufa",
      "description": "Monounsaturated fat intake, g/d",
      "@type": "propertyValue"
    },
    {
      "name": "pufa",
      "description": "Polyunsaturated fat intake, g/d",
      "@type": "propertyValue"
    },
    {
      "name": "cho",
      "description": "Carbohydrate intake, g/d",
      "@type": "propertyValue"
    },
    {
      "name": "fibers",
      "description": "Fibers intake, g/d",
      "@type": "propertyValue"
    },
    {
      "name": "protein",
      "description": "Protein intake, g/d",
      "@type": "propertyValue"
    },
    {
      "name": "roh_g",
      "description": "Alcohol intake, g/d",
      "@type": "propertyValue"
    },
    {
      "name": "calcium",
      "description": "Calcium intake, mg/d",
      "@type": "propertyValue"
    },
    {
      "name": "vit_d",
      "description": "Vitamin D intake, g/d",
      "@type": "propertyValue"
    },
    {
      "name": "calcium_supp",
      "description": "Took a supplement containing calcium",
      "value": "0. No,\n1. Yes",
      "maxValue": 1,
      "minValue": 0,
      "@type": "propertyValue"
    },
    {
      "name": "vit_d_supp",
      "description": "Took a supplement containing vitamin D",
      "value": "0. No,\n1. Yes",
      "maxValue": 1,
      "minValue": 0,
      "@type": "propertyValue"
    }
  ]
}`