Estimating the Effect of Adhering to the Recommendations of the 2019 Canada’s Food Guide on Health Outcomes in Older Adults: Protocol for a Target Trial Emulation
Manuscript
Authors
Affiliations
Didier Brassard
School of Human Nutrition, McGill University
Nancy Presse
Faculty of Medicine and Health Sciences, University of Sherbrooke
Centre de recherche sur le vieillissement, CIUSSS de l’Estrie-CHUS
Stéphanie Chevalier
School of Human Nutrition, McGill University
Research Institute of the McGill University Health Centre
Background: The Canada’s Food Guide 2019 (CFG) provides universal recommendations to individuals aged 2 years or older. The extent to which these recommendations are appropriate for older adults is unknown. Although ideal, conducting a large randomized controlled trial is unrealistic in the short term. An alternative is the target trial emulation framework for causal inference, a novel approach to improve the analysis of observational data.
Objectives: Our aim is to describe the protocol of a target trial emulation in older adults with emphasis on key aspects of a hypothetical sustained diet and physical activity intervention.
Methods: To emulate the target trial, non-experimental data from the NuAge longitudinal study (n=1753, adults aged 67 years or older) will be used. NuAge includes 4 yearly measurements of dietary intakes, covariates and outcomes. The per protocol causal contrast will be the primary causal contrast of interest to account for non-adherence. The sustained intervention strategy will be modelled using the parametric g-formula. In the hypothetical trial, participants would be instructed to meet sex-specific minimal intakes for vegetables and fruits, whole grains, animal- and plant-based protein foods, milk & plant-based beverages and unsaturated fats. Eligibility criteria, follow-up, intervention, outcomes, and causal contrast will be similar in the emulation to the target trial except for minor modifications. We will attempt to emulate randomization of treatment by adjusting for baseline covariates and pre-baseline dietary habits.
Results: Data collection for the NuAge study was completed in June 2008. For the present work, the main analysis has started in May 2024. Submission of the manuscript is expected by December 2024.
Conclusion: Emulating a target trial will provide the first evidence of the adequacy of CFG 2019 recommendations for older adults in relation to health outcomes.
The latest edition of Canada’s Food Guide (CFG) was published in 2019 [1]. Compared with the previous edition, key changes include the removal of the pre-specified number of servings to consume each day, a shift towards qualitative (“eat plenty of…”) instead of quantitative recommendations and the provision of universal recommendations instead of age and sex-specific recommendations. In addition, CFG recommendations primarily aim at reducing chronic disease risk. Indeed, the evidence behind CFG’s recommendations concern mitigation of cardiovascular disease, cancer and type 2 diabetes risk [2]. However, evidence from a nationally representative survey of adults aged 65 years or older from Canada suggested that greater adherence to recommendations was insufficient to meet calcium, vitamin D and folate requirements [3]. In Canada, one third of community-dwelling older adults are at high nutrition risk [4,5], highlighting the importance of maintaining adequate nutritional status in this stratum of the population. Similarly, in absence of specific recommendations on the amount of protein foods to eat, older adults may be eating less protein than required to maintain muscle mass [6–8]. Canada’s Food Guide also provide brief physical activity recommendation, but without explicit acknowledgement of the importance of these recommendations for older adults [1]. Indeed, performing a minimal amount of physical activity is paramount to maintaining muscle mass [6,7]. Thus, the universal recommendations in CFG may not be appropriate for older adults since they face unique challenges to consuming a healthy diet [9], and may require specific nutritional strategies [10].
Ideally, a randomized controlled trial (RCT) would be conducted to investigate the adequacy of CFG recommendations in older adults. However, such RCT is unlikely to be conducted in the short term. An alternative is the target trial emulation framework for causal effect estimation using observational data [11–14]. Informally, the target trial emulation framework is intended to highlight and address design issues of observational data analysis that aims to estimate a causal effect by explicitly emulating a hypothetical trial [11]. In nutritional epidemiology, common issues with design and analyses can yield results that are largely inconsistent with those of randomized trials [15]. For example, the lack of consideration of the compositional nature of diet can dramatically influence effect estimates, i.e., that increasing the intake of one food must compensated by decreasing the intake of another food in substitution modeling [15–17]. Furthermore, diet is a lifelong sustained exposure. In an observational study, the effect of diet assessed at a given time may actually reflect the cumulative exposure to prior dietary habits. In turn, ignoring prior dietary habits may result in a misalignment of “time zero” [18], since dietary habits are not randomly assigned at the beginning of the observational study. In other words, ignoring prior dietary habits makes it impossible to distinguish the effect due to prospective (hypothetical) dietary modification from the effect due to retrospective dietary habits. The target trial framework is a helpful tool to highlight and address common issues in nutritional epidemiology. Ultimately, a successful emulation of the target trial based on observational data could yield effect estimates that more closely align with those of a hypothetical future RCT. Example applications of the target trial framework include the emulation of interventions on diet [19–22], physical activity [23], or both [24].
To the best of our knowledge, the target trial framework has not been used to assess the effect of adhering to CFG’s recommendations. Accordingly, the objectives of the present study are, first, to describe the protocol of the emulation of a target trial using observational data from the NuAge study [25], a cohort of 1753 adults aged 67 to 84 years at baseline, and, second, to address key aspects of the target trial emulation in the context of a sustained lifestyle intervention strategy involving diet and physical activity. Key aspects are the description of the sustained lifestyle intervention strategy, the attempt to emulate randomization, as well as assumptions and limitations specific to diet intervention. Of note, more general introductory texts to the target trial framework are available elsewhere [11,12,14].
Methods
Research Question and Hypothesis
Explicitly acknowledging the causal nature of a research question is prerequisite to causal effect estimation using observational data [26–28]. The general objective of this study will be to examine the adequacy of CFG’s universal dietary recommendations for older adults. Expressed as a counterfactual statement, our objective is to answer the following question:
What would be the difference in a given health outcome at the end of the follow-up, if all eligible participants had increased their adherence to CFG recommendations on healthy food choices compared with, instead, if they had maintained their habitual diet?
Specifically, among adults aged 67 to 84 years followed over 3 years, and compared with maintenance of habits, we aim to:
Estimate the causal effect of adhering to CFG’s dietary recommendations on markers of muscle health (e.g., physical function, muscle strength), general health (e.g., waist circumference, blood pressure, glucose), and cognitive health (i.e., Modified Mini-Mental State Exam) .
Hypothesis: adhering to recommendations positively influence general and cognitive health but has no influence on muscle health.
Estimate the causal effect of adhering to a reformulation of CFG’s dietary recommendations, including more protein foods and a minimal physical activity recommendation, to amplify the positive health effects.
Hypothesis: increasing the consumption of protein-rich foods positively influence muscle health, and meeting minimal physical activity recommendation (30 minutes or more per day) further amplifies positive health effects.
Study Design and Sample
Data from the NuAge prospective cohort study will be used to emulate the target trial [25]. The NuAge cohort comprised 1753 generally healthy community-dwelling adults aged 67 to 84 years at baseline and followed over 3 years. The baseline and each annual follow-up included comprehensive assessment on sociodemographic data, diet, physical activity, functional status as well as physical and mental health [25].
The NuAge study sample is relevant to our research question. The target population of CFG recommendations comprise all individuals aged 2 years or older, which is compatible with the target sample of the NuAge study of generally healthy older adults from the greater Montreal, Sherbrooke and Laval areas, the province of Quebec, Canada.
Target trial
The target trial framework has been suggested as a potential solution to improve the analysis of nutritional epidemiology studies aiming at causal inference [13]. Informally, the target trial framework helps to align the observational data analysis with that of a hypothetical trial. This framework is appropriate for the research question in the present study, since we aim to estimate the effect of adhering to a hypothetical diet and physical activity intervention using on observational data. The first step of a target trial emulation is the description of the target trial, i.e., the protocol of the hypothetical randomized controlled trial we would like to conduct [11,14]. The second step is the emulation, i.e., describing how to target trial is emulated and conducting the study described in the present protocol.
Table 1 presents the target trial and its emulation using observational data from the NuAge study. Key differences between the target trial and its emulation are that participants will be required to provide complete dietary assessment and covariate data at baseline (eligibility component); and that we will attempt to emulate the randomized assignment by adjusting for dietary intakes before baseline as well as baseline covariates (assignment component).
Code
# #| label: tbl-target# #| tbl-cap: "Target trial"# *********************************************************************** ## Generate table presenting the target trial ## *********************************************************************** #tab_targettrial <- readxl::read_excel(file.path(dir_results,"Table_data.xlsx"),sheet ="targettrial") |> gt::gt() |> gt::cols_label(component ="Trial component",target ="Target trial specification",emulation ="Target trial emulation" ) |> gt::tab_style(style =cell_text(weight ="bold"),locations =cells_body(columns=1) ) |> gt::tab_style(style =list(cell_text(weight ="bold") ),locations =cells_column_labels(columns=everything()) ) |> gt::tab_header(title ="Emulation of a dietary intervention target trial using observational data from the NuAge study") |> gt::tab_footnote(footnote ="FFQ, food-frequency questionnaire; NuAge, Quebec Longitudinal Study on Nutrition and Successful Aging",locations =cells_title("title") ) |> gt::tab_footnote(footnote ="See 'Dietary Strategies' for detailed intervention.",locations =cells_body(columns="component",rows=2) ) |> gt::tab_footnote(footnote ="The observational analog of the intention-to-treat contrast corresponds to the baseline values of the intervention, which are both 'assigned' and initiated at the same time.",locations =cells_body(columns="component", rows=6) )# ********************************************** ## Print table ## ********************************************** #if(print_table=="Y") {tab_targettrial |>gtstyle()}
Emulation of a dietary intervention target trial using observational data from the NuAge study1
Trial component
Target trial specification
Target trial emulation
Eligibility criteria
NuAge inclusion criteria: individuals aged 67-84 y; living in Montreal, Laval or Sherbrooke; not cognitively impaired, free of disabilities in activities of daily living. Exclusion criteria: class II heart failure, chronic obstructive pulmonary disease requiring home oxygen therapy or oral steroids, inflammatory digestive diseases, and cancer treatment in the past 5 years.
Same. Participants will also be required to have complete baseline dietary assessment (at least one 24-hour recall with 500 kcal or more and FFQ) and baseline covariate data
Intervention2
Each individual would be assigned to 1 of the 4 following strategies: 1) control group (habitual diet, i.e., typical North American); 2) adherence to Canada's Food Guide recommendations on healthy food choices; 3) same as 2) but including a 'high-protein' reformulation; 4) same as 3) but including a minimal physical activity component. Each strategy is followed until the end of follow-up. Participants assigned to a lifestyle strategy are expected to maintain their dietary intake or amount of physical activity at or above the prespecified threshold by the corresponding intervention strategy.
Same. We will assume that each dietary assessment period (i.e., within 2 months beginning at each timepoint) accurately reflects the average diet in the interval between follow-ups.
Assignment
Participants are randomly assigned to a dietary strategy, but are not blinded to their assignment.
We will attempt to emulate randomized assignment by adjusting for dietary intakes before baseline and baseline covariates.
Outcomes
Physical function and muscle strength, general health indicators, and cognitive health
Same.
Time zero and follow-up
Starts at baseline and ends at incomplete follow-up, or 3 y after baseline, whichever occurs first.
Same. An incomplete follow-up is defined as missing data for questionnaires (non-response or loss to follow-up) or missing outcome data at the end of follow-up.
Causal contrast3
• Intention-to-treat effect • Per-protocol effect
Observational analog of both contrasts: • Intention-to-treat effect (secondary) • Per-protocol effect (primary)
Statistical analysis
• Intention-to-treat analysis: apply inverse probability weighting with adjustment for pre- and baseline factors associated with incomplete follow-up to account for study dropouts • Per-protocol analysis: apply the parametric g-formula algorithm to compare post-intervention outcomes between groups receiving each treatment strategy with adjustment for pre- and postbaseline factors associated with adherence to intervention strategies and incomplete follow-up.
Same for both contrasts. Except that the observational analog will require additional adjustment for confounding at baseline and before baseline due to prior diet.
1 FFQ, food-frequency questionnaire; NuAge, Quebec Longitudinal Study on Nutrition and Successful Aging
2 See 'Dietary Strategies' for detailed intervention.
3 The observational analog of the intention-to-treat contrast corresponds to the baseline values of the intervention, which are both 'assigned' and initiated at the same time.
Code
# ********************************************** ## Save table ## ********************************************** #gt::gtsave(tab_targettrial,filename =file.path(dir_tab,"tab_targettrial.docx"))
Each part of the target trial and its emulation are described below.
Eligibility Criteria
The inclusion criteria for the target trial are the same as for the NuAge study [25]. In the emulation, participants will be required to have at least one 24-hour dietary recall completed at baseline with 500 calories or more, as well as complete covariate data at baseline, as identified below.
Hypothetical Interventions
The hypothetical intervention strategies evaluated will be:
no change in dietary habits or physical activity (“control” intervention);
adherence to CFG’s recommendations;
adherence to CFG’s recommendations including reformulation (i.e., higher intake of protein foods);
adherence to CFG’s recommendations including reformulation (i.e., higher intake of protein foods) and performing at least 30 minutes of aerobic physical activity.
Physical activity recommendations are not traditionally at the forefront of CFG’s recommendations. However, CFG does mention that “at least 150 minutes of moderate-to vigorous-intensity aerobic physical activity per week […] is recommended to achieve health benefits” [1]. Thus, recognizing the key role of exercise to maintaining health and muscle for older adults, the 4th hypothetical intervention includes a formal physical activity recommendation. In the target trial, the physical activity corresponds to performing aerobic exercise of light to vigorous-intensity aerobic for at least 30 minutes per day [6].
The challenge of a well-defined nutritional intervention
Emulating a well-defined dietary intervention for CFG’s recommendations is challenging. First, recommendations in the latest edition of CFG are qualitative and flexible (e.g., “Eat plenty of vegetables and fruits”; [1,29]). Thus, multiple suitable, but nonetheless very different, dietary patterns can achieve adherence to recommendations. Second, CFG’s recommendations target both food intakes (e.g., vegetables and fruits) and nutrients (e.g., saturated fats). The nutrient-based recommendations can be achieved by intervening on the consumption of multiple different foods. For example, to achieve the hypothetical intervention “decreasing consumption of calories from saturated fats” one could decrease saturated fats from dairy, nuts and low nutritive value foods altogether. Arguably, the relationship between these food categories and a given health outcome may vary greatly.
To estimate a causal effect using observational data, the hypothetical interventions must be sufficiently well-defined or that until “no meaningful variation” of that intervention remains [30,31]. In other words, the hypothetical diet interventions should be elaborated until no additional dietary characteristics are deemed impactful in regards of the outcome of interest. Another consideration is that the modelling of hypothetical interventions should ideally be conducted with dietary intakes expressed using the same units. For example, mixing food intakes expressed in servings and grams in a statistical model may cause poor estimation of causal effects [17]. Finally, the statistical approach used to account for ‘total energy’ or total food intake also affects the causal effect of interest and should be consistent with the research question [17,31–33].
Diet Simulations
Code
# ********************************************** ## Output sim. diet data ## ********************************************** ## note: loading done in set-up chunk. See code <1.0-Data_preparation.R> for details# ********************************************** ## Output vectors of CFG foods ## ********************************************** #recommended <-c("vegetables and fruits","whole-grain foods","protein foods","unsweetened milk and plant-based beverages with protein")notrecommended <-c("non-whole grain foods","other low nutritive value foods","juice, sugary drinks and alcohol","fatty foods rich in saturated fats")
For the present study, adherence to CFG’s recommendations was defined based on simulated diets generated by Health Canada [34] and summarized in Supplemental Table 1. The simulated diets were designed to meet both CFG’s recommendations on healthy food choices and nutrient requirements (Dietary Reference Intake).
These diets achieve near perfect Healthy Eating Food Index (HEFI)-2019 scores (>78/80) through relatively high intakes of recommended foods (i.e., vegetables and fruits, whole-grain foods, protein foods, and unsweetened milk and plant-based beverages with protein) and null intakes of foods not recommended (i.e., non-whole grain foods, other low nutritive value foods, juice, sugary drinks and alcohol, and fatty foods rich in saturated fats). The HEFI-2019 score indicates the extent to which dietary intakes are consistent with CFG’s recommendations on healthy food choices [29,35].
Note that the HEFI-2019 could have been used as main exposure to measure adherence to CFG. However, the use of a composite score metric would not fully satisfy the criterion of a well-defined intervention to estimate a causal effect. First, high HEFI-2019 scores, and high adherence to CFG’s recommendations, can be achieved through many different strategies or dietary patterns. In the context of observational data, the specific strategies through which individuals achieve high HEFI-2019 score would be based on dietary habits and patterns self-selected by the participants. This approach is similar to asking hypothetical trial participants to modify their intakes without clearly indicating how, which would obscure the causal effect estimated. Second, the HEFI-2019 score includes recommendations both on foods and on nutrients. As described above, mixing servings and grams in a statistical models may cause poor estimation of causal effects [17].
We stress that the diets simulated by Health Canada were not actually consumed by older adults. For this reason, the simulated values for vegetables and fruits, whole-grain foods and plant-based protein foods exceed the 99th percentile of the distribution of usual intakes of these food categories as estimated in adults aged 65 years or more from the Canadian Community Health Survey 2015 - Nutrition [3]. In Table 2, the target intakes vegetables and fruits, whole grains, and plant-based protein foods for the adhering to Canada’s Food Guide 2019 recommendations intervention were revised to correspond, at most, to the 90th percentile of the distribution of usual intakes among Canadians aged 65 years or more in 2015 [3]. Since Canada’s Food Guide 2019 does not have a portion size system, reference amounts (RA) were used as a proxy for servings. RA are regulated quantity of foods that reflect the portion size typically consumed at 1 sitting in Canada. RA were used by Health Canada to simulate diet consistent with Canada’s Food Guide 2019 recommendations and Dietary Reference Intake (Supplemental Table 1), hence RAs are adequate for the present work.
Implementation
In the target trial, the sustained intervention strategy could be implemented as follows:
the participant’s usual dietary intakes and physical activity would be assessed by research dietitians at each study visit;
if reported food intakes and duration of physical activity were equal to or above the prespecified thresholds (Table 2), no change would be suggested to the participants’ diet or physical activity If food intakes or duration of physical activity were below the prespecified thresholds, participants would be instructed to increase food consumption to exactly the prespecified portions or increase physical activity duration to 30 minutes per day (when applicable);
if changes are required, participants would be instructed to decrease consumption of foods not recommended to the extent of the increase in (2). For example, if a 2-serving increase in vegetables and fruits is required to meet the pre-specified intervention thresholds, participants would be instructed to substitute 2 servings of vegetables and fruits for non-whole grain foods, other low nutritive value foods, juice, sugary drinks and alcohol, and fatty foods rich in saturated fats.
In the emulation, for all hypothetical interventions, the substitution will be implemented by including “total intakes” as a covariate and leaving out foods not recommended from the models. More precisely, a variable reflecting total food intake (in RA/day) and a variable reflecting total beverage intake (in RA/day) will be included in all models. Hence, total food and beverage intakes will be constant across hypothetical diet interventions. In this approach to account for “total energy”, all model coefficients reflect the action of increasing intakes of recommended foods and a concomitant decrease in any of the foods not recommended [32]. On the one hand, this approach is potentially confusing [17,33], since the default interpretation of model coefficients is the action of increasing the intake of each food included in the model, while decreasing the intake of foods not in the model[32]. On the other hand, the standard model is generally consistent with the implementation of dietary intervention in feeding trials [16,36,37]. The standard model also reduces the number of variables to be considered as intervention variables. Otherwise, 4 additional dietary components would have to be modelled for foods not recommended (i.e., non-whole grain foods, other low nutritive value foods, juice, sugary drinks and alcohol, and fatty foods rich in saturated fats). Finally, the explicit description of the intervention strategies in the target trial protocol clarifies the estimand of interest, as done previously [19,31].
Of note, nutrient-based recommendations in CFG (i.e, saturated fats, free sugars and sodium) are not explicitly modelled to avoid the problems associated with mixed-unit models [17]. In the target trial, we assume that nutrient-based targets would be met by reducing consumption of foods not recommended (i.e., non-whole grain foods, other low nutritive value foods, juice, sugary drinks and alcohol, and fatty foods rich in saturated fats). In that regard, food-level substitution analyses in Canadians support this assumption for saturated fats [38,39].
Code
# #| label: tbl-dietint# #| tbl-cap: "Diet intervention"# *********************************************************************** ## Generate table presenting interventions ## *********************************************************************** ## ********************************************** ## CFG reformulation intervention values ## ********************************************** #pfab_int <-1.5pfpb_int <-0.5milk_int <-0.5# ********************************************** ## Full intervention data ## ********************************************** #data_dietint <- readxl::read_excel(file.path(dir_results,"Table_data.xlsx"),sheet ="dietint") |># Indicate values that are unchanged by interventionmutate(## Animal-based protein interventionpfab =ifelse(int>2, pfab+pfab_int, pfab),## Plant-based protein interventionpfpb =ifelse(int>2, pfpb+pfpb_int, pfpb),## Milk and pant beverages with sufficient proteinmilk_plantbev =ifelse(int>2, milk_plantbev+milk_int, milk_plantbev),## add labels and common valuesdietsuppl =ifelse(int>1, "No change",dietsuppl),exercise =ifelse(int>1& int!=4, "No change",exercise),across(c("otherfoods", "otherbev", "rg"),function(x) ifelse(int>1&is.na(x),"Minimum",x)) )# add factor for clean labelsdata_dietint$drig_f <-factor(data_dietint$drig,levels=c(0,12,13,14,15),labels =c("All, 51y+","Males, 67-70 y","Females, 67-70 y","Males","Females"))data_dietint$int_f <-factor(data_dietint$int,levels=c(1,2,3,4),labels =c("1. Control (no change)","2. Adhering to Canada's Food Guide 2019 recommendations on healthy food choices","3. Same as 2 + extra protein","4. Same as 3 + physical activity"))# ********************************************** ## Generate table ## ********************************************** #tab_dietint <- data_dietint |>group_by(int_f) |> gt::gt() |> gt::cols_move_to_start(columns=c(int_f,drig_f)) |> gt::cols_move_to_end(columns=c(exercise)) |> gt::cols_hide(columns =c(drig,int)) |> gt::tab_spanner(label="Recommended foods, RA/day",columns =c(vf,wg,pfpb,pfab, milk_plantbev, ufa)) |> gt::tab_spanner(label="Foods and beverages not recommended, RA/day",columns =c(otherfoods, otherbev, rg)) |> gt::cols_label(int ="Intervention",drig_f ="Sex",vf ="Vegetables & fruits",wg ="Whole grains",pfpb ="Protein foods, plant-based",pfab ="Protein foods, animal-based",milk_plantbev ="Milk & Plant-based bev. with protein",ufa ="Unsaturated oils & fats",dietsuppl ="Dietary supplement",otherfoods ="Other foods",otherbev ="Sugary drinks, alcohol",rg ="Non-whole grains",exercise ="Physical activity, minutes/day") |> gt::sub_missing(missing_text ="-") |> gt::tab_header(title ="Hypothetical diet and exercise interventions emulated in the NuAge cohort study, by sex") |> gt::tab_footnote(footnote = glue::glue("The emulation of all hypothetical interventions will be implemented using a substitution approach in statistical models. In all models, one variable for 'total food intake' and one variable for 'total beverage intake' will be included, and foods not recommended will be left out from the models (i.e., {knitr::combine_words(notrecommended)}). CFG, Canada's Food Guide; NuAge, Quebec Longitudinal Study on Nutrition and Successful Aging; RA, reference amount; y, year"),locations =cells_title("title") ) |># Indicate what are 'control' values gt::tab_footnote(footnote ="Values are averages observed at baseline in the NuAge cohort. In other words, values are the observed intakes for the food categories or amount of physical activity when no change is applied.",locations =cells_row_groups(groups =attributes(data_dietint$int_f)$levels[1]) ) |># Indicate what are 'CFG adherence' values gt::tab_footnote(footnote ="Values are derived from Health Canada's simulated composite diets of adults 71 years or older. Participants would be expected to meet these targets for each food categories. The specific food choices within these categories would be at the participants' discretion. Values for vegetables and fruits, whole-grain foods and plant-based protein foods were truncated to correspond, at most, to the 90th percentile of the distribution of usual intakes among Canadians aged 65 years in 2015.",locations =cells_row_groups(groups =attributes(data_dietint$int_f)$levels[2]) ) |># Indicate what is the extra protein treatment gt::tab_footnote(footnote = glue::glue("Extra protein foods were added as follows: +{pfpb_int} RA of plant-based protein foods (e.g., {pfpb_int*50} grams of nuts), +{pfab_int} RA of animal-based protein foods (e.g., {pfab_int*100} grams of cooked unprocessed red meat, fish or poultry or {round(pfab_int*100/50)} small eggs), +{milk_int} RA of milk or plant-based beverage with protein (e.g., {milk_int*250} ml of milk or plant-based beverages with sufficient protein)."),locations =cells_row_groups(groups =attributes(data_dietint$int_f)$levels[3]) ) |># Indicate meaning of dietary supplement column gt::tab_footnote(footnote ="Dietary supplements were not intervened on, but were nonetheless excluded from foods and beverages not recommended to avoid being considered in the substitution. In other words, participants would be not be instructed to modify their dietary supplements in the hypothetical trial.",locations =cells_column_labels(columns="dietsuppl") ) |># Describe exercise gt::tab_footnote(footnote ="Physical activity corresponds to aerobic exercise of moderate intensity or higher (Bauer et al. 2013).",locations=cells_column_labels(columns="exercise") ) |># Indicate what are 'Minimum' values gt::tab_footnote(footnote ="Minimum indicates that consumption would be set at the smallest amount permitting a concomitant increase in recommended foods to meet Canada's Food Guide targets. Portions for foods not recommended may vary on an individual basis.",locations =cells_column_spanners(spanners="Foods and beverages not recommended, RA/day")#cells_body(columns=c("otherfoods":"rg"),rows=3:nrow(data_dietint) ) ) # ********************************************** ## Print table ## ********************************************** #if(print_table=="Y") { tab_dietint |>gtstyle()}
Hypothetical diet and exercise interventions emulated in the NuAge cohort study, by sex1
Sex
Recommended foods, RA/day
Dietary supplement3
Foods and beverages not recommended, RA/day2
Physical activity, minutes/day4
Vegetables & fruits
Whole grains
Protein foods, plant-based
Protein foods, animal-based
Milk & Plant-based bev. with protein
Unsaturated oils & fats
Other foods
Sugary drinks, alcohol
Non-whole grains
1. Control (no change)5
Males
-
-
-
-
-
-
-
-
-
-
-
Females
-
-
-
-
-
-
-
-
-
-
-
2. Adhering to Canada's Food Guide 2019 recommendations on healthy food choices6
Males
6
1.5
1.0
2.0
1.0
1
No change
Minimum
Minimum
Minimum
No change
Females
5
1.5
0.8
1.5
1.0
1
No change
Minimum
Minimum
Minimum
No change
3. Same as 2 + extra protein7
Males
6
1.5
1.5
3.5
1.5
1
No change
Minimum
Minimum
Minimum
No change
Females
5
1.5
1.3
3.0
1.5
1
No change
Minimum
Minimum
Minimum
No change
4. Same as 3 + physical activity
Males
6
1.5
1.5
3.5
1.5
1
No change
Minimum
Minimum
Minimum
30 or more
Females
5
1.5
1.3
3.0
1.5
1
No change
Minimum
Minimum
Minimum
30 or more
1 The emulation of all hypothetical interventions will be implemented using a substitution approach in statistical models. In all models, one variable for 'total food intake' and one variable for 'total beverage intake' will be included, and foods not recommended will be left out from the models (i.e., non-whole grain foods, other low nutritive value foods, juice, sugary drinks and alcohol, and fatty foods rich in saturated fats). CFG, Canada's Food Guide; NuAge, Quebec Longitudinal Study on Nutrition and Successful Aging; RA, reference amount; y, year
2 Minimum indicates that consumption would be set at the smallest amount permitting a concomitant increase in recommended foods to meet Canada's Food Guide targets. Portions for foods not recommended may vary on an individual basis.
3 Dietary supplements were not intervened on, but were nonetheless excluded from foods and beverages not recommended to avoid being considered in the substitution. In other words, participants would be not be instructed to modify their dietary supplements in the hypothetical trial.
4 Physical activity corresponds to aerobic exercise of moderate intensity or higher (Bauer et al. 2013).
5 Values are averages observed at baseline in the NuAge cohort. In other words, values are the observed intakes for the food categories or amount of physical activity when no change is applied.
6 Values are derived from Health Canada's simulated composite diets of adults 71 years or older. Participants would be expected to meet these targets for each food categories. The specific food choices within these categories would be at the participants' discretion. Values for vegetables and fruits, whole-grain foods and plant-based protein foods were truncated to correspond, at most, to the 90th percentile of the distribution of usual intakes among Canadians aged 65 years in 2015.
7 Extra protein foods were added as follows: +0.5 RA of plant-based protein foods (e.g., 25 grams of nuts), +1.5 RA of animal-based protein foods (e.g., 150 grams of cooked unprocessed red meat, fish or poultry or 3 small eggs), +0.5 RA of milk or plant-based beverage with protein (e.g., 125 ml of milk or plant-based beverages with sufficient protein).
Code
# ********************************************** ## Save table ## ********************************************** #gt::gtsave(tab_dietint,filename =file.path(dir_tab,"tab_dietint.docx"))
The “additional protein” intervention consists of increasing the intake of both animal-based and plant-based protein foods by 1.5 and 0.5 RA per day, respectively, as well as milk and plant-based beverages with sufficient protein by 0.5 RA per day. In terms of amount of food, this corresponds to adding 150 grams of cooked unprocessed red meat, fish or poultry or 3 small eggs, 25 grams of nuts and seeds and 125 ml of milk or plant-based beverages with sufficient protein, while proportionally decreasing the intake of foods not recommended. In a previous RCT [40], older women aged 60 to 90 years were able to consume an additional 160 grams of cooked lean red meat without substitution, hereby supporting the feasibility of the protein intervention in the present hypothetical study.
Assignment
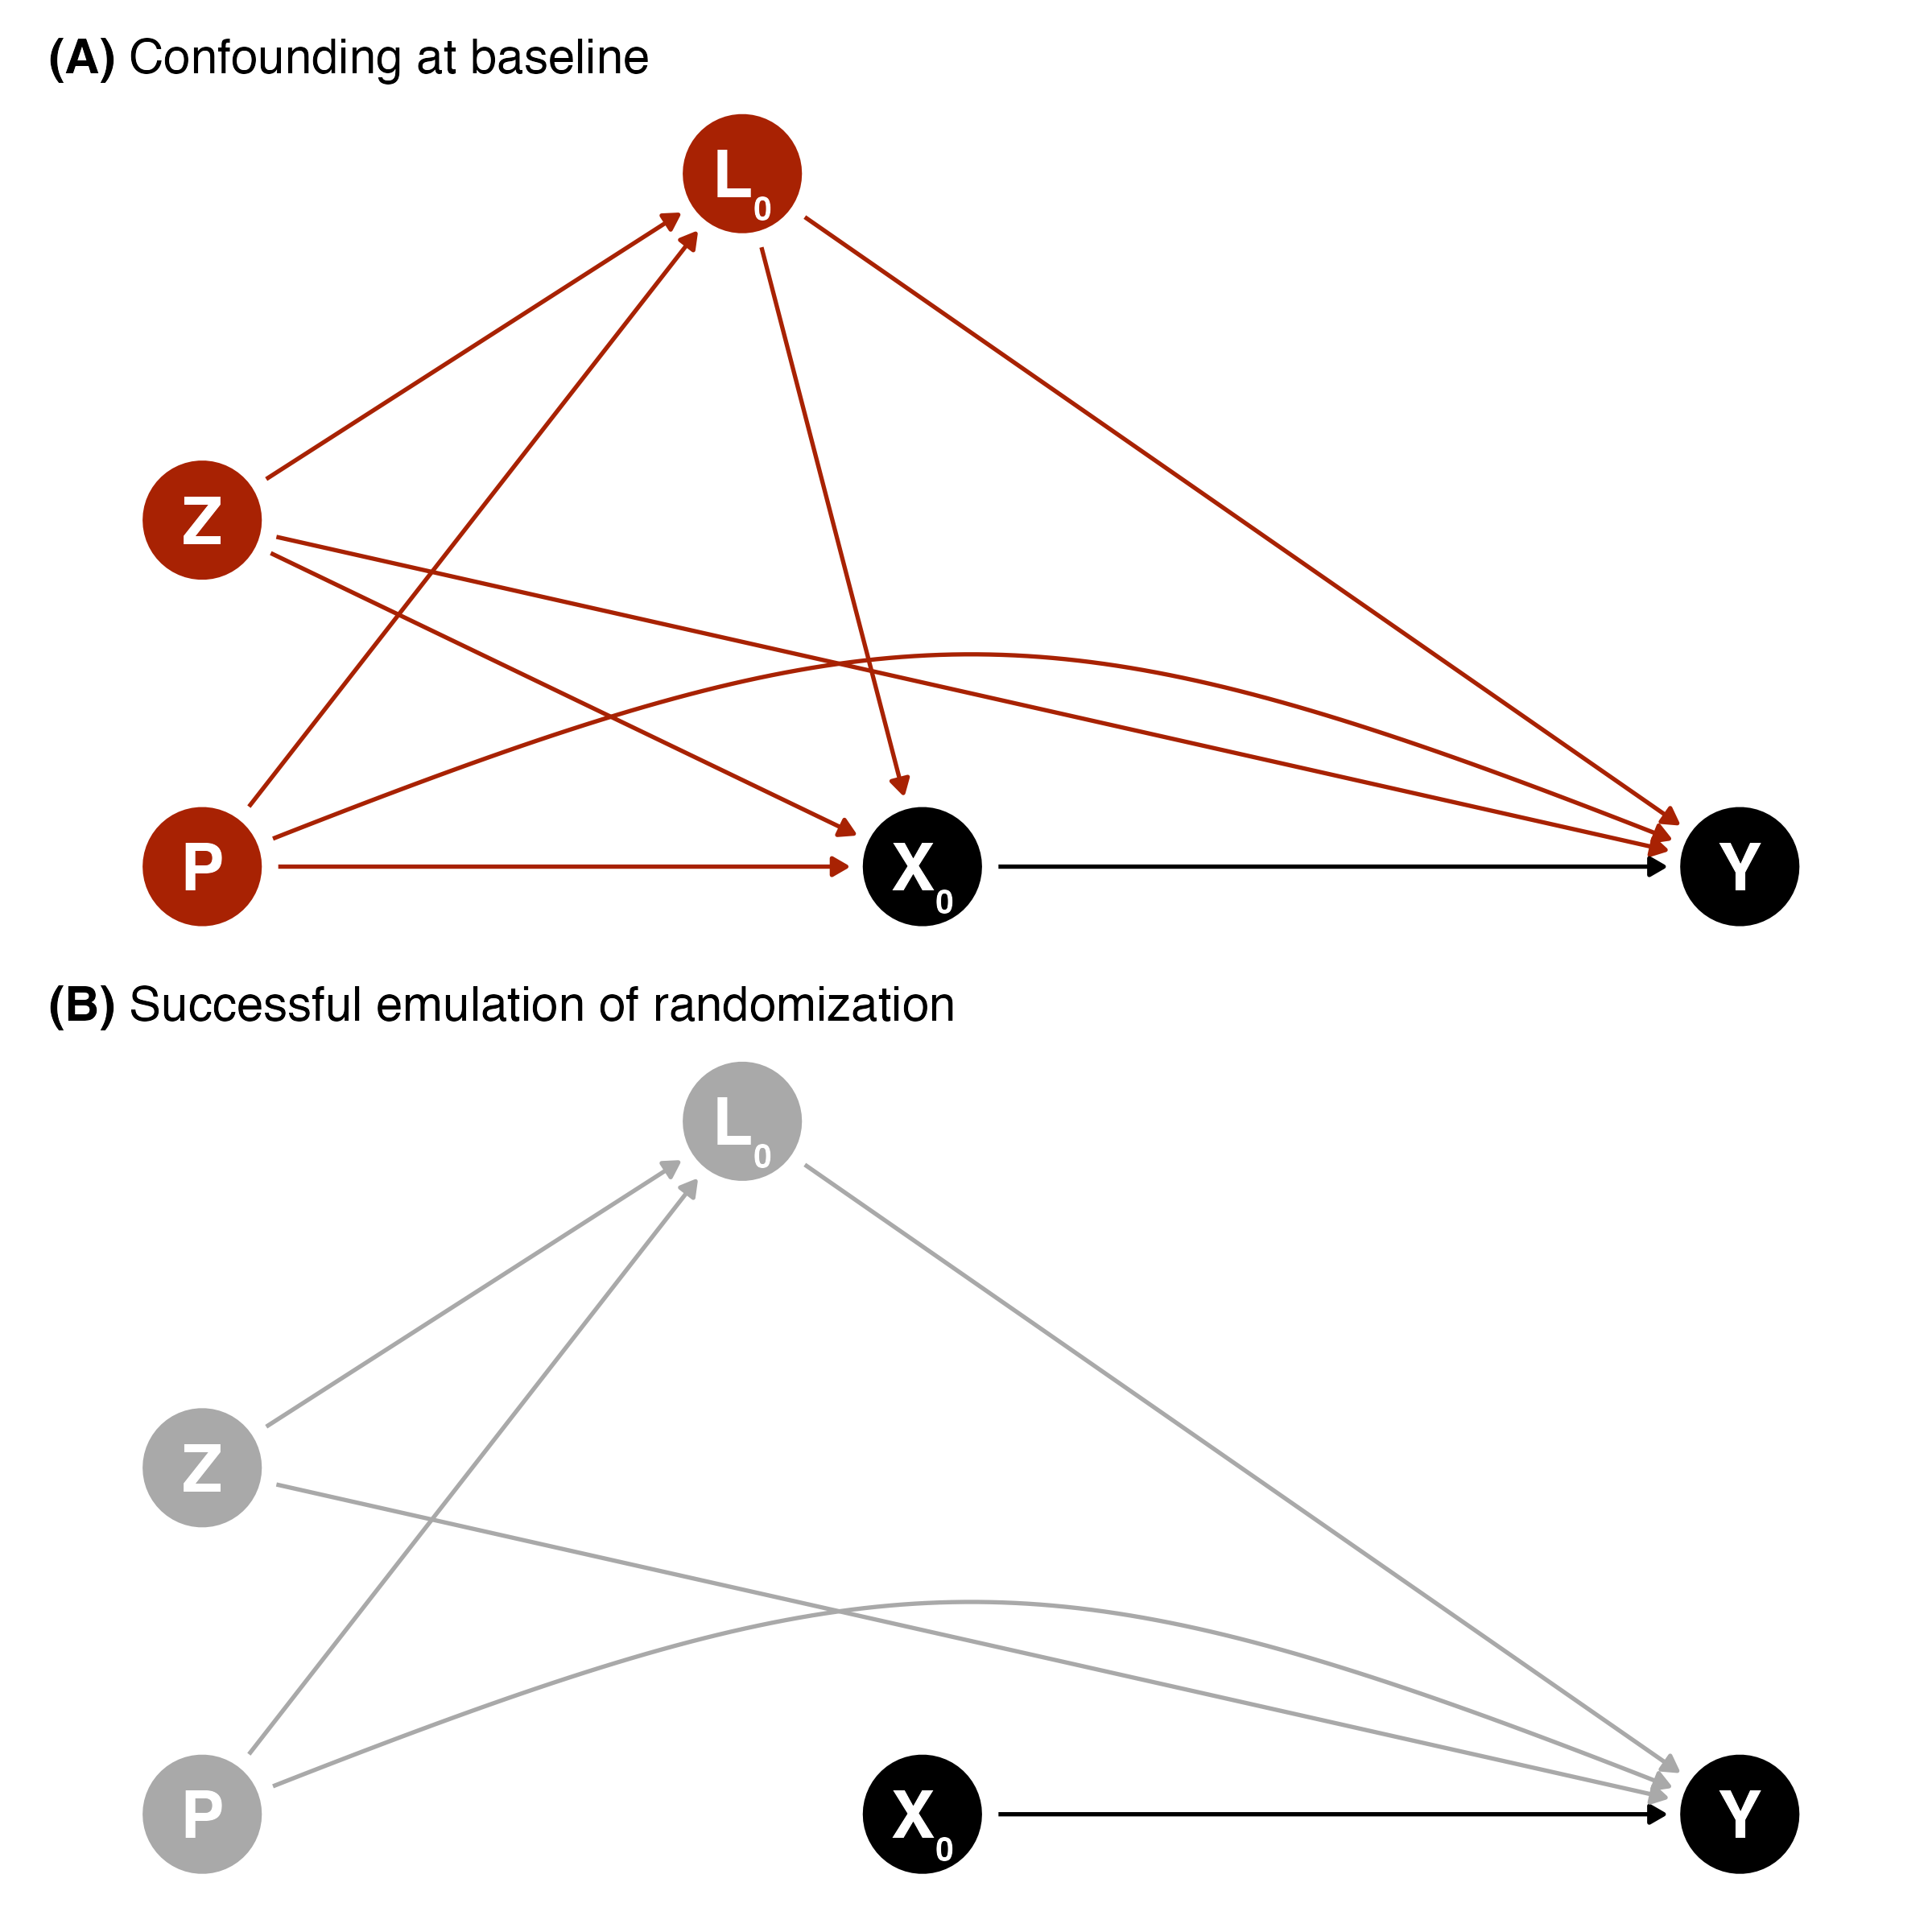
Random allocation (randomization) will be emulated by adjusting for dietary intakes in the year prior to the intervention, as well as adjusting for covariates at the start of the study. Covariates were identified using the causal diagrams depicted in Figure 1 based on background knowledge of the relationship between the hypothetical lifestyle intervention and outcomes.
Dietary components that are the foundation for healthy eating in CFG include intakes of vegetables and fruits, whole grains, protein foods (plant- and animal-based protein foods, milk and plant-based beverages with protein), unsaturated oils and fats [1].
Covariates include age at baseline, biological sex, region, education, living alone, smoking and drinking (alcohol) habits, major chronic diseases (i.e., hypertension, diabetes, cancer, heart disease), number of medications, supplement use (e.g., vitamins and minerals), living alone, and height and weight.
\(Z\), baseline covariates: age, sex, region, education, history of smoking, height, former cancer.
\(P\), prior exposure (i.e., exposure of time-varying intervention prior to baseline): dietary habits before baseline
\(L\), (time-varying) covariates: weight, number of medications, supplement use, living alone, major chronic diseases (hypertension, diabetes, cancer, heart disease), smoking and alcohol habits
\(X\), (time-varying) treatment: diet and physical activity habits
\(Y\), end of follow-up outcome: muscle health, general health, cognitive health.
Code
# ********************************************** ## Input Dagitty information ## ********************************************** ## Dagitty framedag_rand_generic <- dagitty::dagitty('dag {bb="0,0,1,1""P-1" [pos="0.100,0.300",Xdjusted="1"]L0 [pos="0.250,0.500",Xdjusted="1"]X0 [exposure,pos="0.300,0.300"]Y [outcome,pos="0.527,0.300"]Z [pos="0.100,0.400"]"P-1" -> L0"P-1" -> X0"P-1" -> Y [pos="0.260,0.400"]L0 -> X0L0 -> YX0 -> YZ -> L0Z -> X0Z -> Y}')# Transform to ggdagdag_rand_generic <- ggdag::tidy_dagitty(dag_rand_generic)# Generate second set of coordinates for edge-arc dag_rand_generic <- dag_rand_generic |>mutate(## create second set of coordinates for edge-arc# x coordinatesxend_arc =case_when( name=="P-1"& to =="Y"~ xend ,.default =NA ),# y coordinatesyend_arc =case_when( name=="P-1"& to =="Y"~ yend ,.default =NA ),# remove straight edge for those flag with arcxend =ifelse(is.na(xend_arc),xend,NA),yend =ifelse(is.na(yend_arc),yend,NA), )# *********************************************************************** ## Generate panel A with confounding ## *********************************************************************** ## ********************************************** ## Labelling and colors ## ********************************************** ## Use default color to draw attention to the path of interestsdefault_colour <-"black"highlight_colour <-"#a82203"# MetBrewer::met.brewer("Juarez",n=1)# Add colorsdag_rand_unadjust <- dag_rand_generic |>mutate(name_colour =ifelse(name!="X0",highlight_colour,default_colour),name_line ="solid" ) name_colour <-c("X0"= default_colour,"L0"= highlight_colour,"Y"= default_colour,"P-1"= highlight_colour, "Z"= highlight_colour )# add nodes label for ggplotdag_rand_unadjust_labels <-data.frame(dag_rand_unadjust) |> dplyr::mutate(label =case_when( name =="X0"~"X\u2080", name =="L0"~"L\u2080", name =="Y"~"Y", name =="P-1"~"P", name =="Z"~"Z") ) |> dplyr::pull(label)# ********************************************** ## Create DAG with ggplot ## ********************************************** #make_dag_rand_A <-function(scale_node_size=1, text_size=4, default_node_size=16){# note: text size default is 4# calculate node size as a factor x default node_size <- default_node_size * scale_node_sizefig_dag_rand_unadjust <- dag_rand_unadjust |>ggplot(aes(x = x,y = y,xend = xend,yend = yend )) +geom_dag_point(aes(colour = name),size = node_size,show.legend=FALSE) +geom_dag_edges(aes(edge_colour = name_colour,edge_linetype = name_line)) +geom_dag_edges_arc(aes(xend = xend_arc,yend = yend_arc,edge_colour = name_colour,edge_linetype = name_line),curvature=0.25) +scale_colour_manual(values = name_colour) +geom_dag_text(aes(label=dag_rand_unadjust_labels), size=text_size) +theme_dag()return(fig_dag_rand_unadjust)}# Generate figure for different layout## normal versionfig_unadjust_normal <-make_dag_rand_A(text_size=7) +labs(title="**(A)** Confounding at baseline") +theme(plot.title = ggtext::element_markdown())## JMIR formatfig_unadjust_jmir <-make_dag_rand_A(scale_node_size=0.5, text_size=3.5) +labs(title="**(A)** Confounding at baseline") +theme(plot.title = ggtext::element_markdown(size=10))## JMIR TOC figurefig_dag_unadjust_jmir_toc <-make_dag_rand_A(scale_node_size=0.5, text_size=3.5) +theme(plot.title = ggtext::element_markdown(size=10),panel.background =element_rect(fill ="white", color=NA), plot.background =element_rect(fill ="white", color=NA) )# *********************************************************************** ## Generate panel B without confounding ## *********************************************************************** ##note: starts based on 'dag_rand_generic' created above, but colors and path updated to highlight adjustment# ********************************************** ## Labelling and colors ## ********************************************** ## Use default color to draw attention to the path of interestsdefault_colour <-"black"highlight_colour <-"darkgray"# Add colorsdag_rand_adjust <- dag_rand_generic |>mutate(# Color of point/edge/linesname_colour = highlight_colour,name_colour =ifelse(name=="X0"& to=="Y", default_colour, name_colour),name_line ="solid" ) |># Remove confounding as estimated in a pseudo-populationfilter(!(to=="X0"& name %in%c("P-1", "Z", "L0")))name_colour <-c("X0"= default_colour,"L0"= highlight_colour,"Y"= default_colour,"P-1"= highlight_colour, "Z"= highlight_colour )# add nodes label for ggplotdag_rand_adjust_labels <-data.frame(dag_rand_adjust) |> dplyr::mutate(label =case_when( name =="X0"~"X\u2080", name =="L0"~"L\u2080", name =="Y"~"Y", name =="P-1"~"P", name =="Z"~"Z") ) |> dplyr::pull(label)# ********************************************** ## Create DAG with ggplot ## ********************************************** #make_dag_rand_B <-function(scale_node_size=1, text_size=4, default_node_size=16){# calculate node size as a factor x default node_size <- default_node_size * scale_node_sizefig_dag_rand_adjust <- dag_rand_adjust |>ggplot(aes(x = x,y = y,xend = xend,yend = yend )) +geom_dag_point(aes(colour = name),size = node_size,show.legend=FALSE) +geom_dag_edges(aes(edge_colour = name_colour,edge_linetype = name_line)) +geom_dag_edges_arc(aes(xend = xend_arc,yend = yend_arc,edge_colour = name_colour,edge_linetype = name_line),curvature=0.25) +scale_colour_manual(values = name_colour) +geom_dag_text(aes(label=dag_rand_adjust_labels), size=text_size) +theme_dag()return(fig_dag_rand_adjust)}# Generate figure for different layout## normal versionfig_adjust_normal <-make_dag_rand_B(text_size=7) +labs(title="**(B)** Successful emulation of randomization") +theme(plot.title = ggtext::element_markdown())## JMIR formatfig_adjust_jmir <-make_dag_rand_B(scale_node_size=0.5, text_size=3.5) +labs(title="**(B)** Successful emulation of randomization") +theme(plot.title = ggtext::element_markdown(size=10))# *********************************************************************** ## Append both DAG with/without confounding ## *********************************************************************** ## note: done using patchwork libraryfig_dag_rand_normal <- fig_unadjust_normal / fig_adjust_normalfig_dag_rand_jmir <- fig_unadjust_jmir / fig_adjust_jmir# ********************************************** ## Save as png/pdf ## ********************************************** ## Normal version, pdf and pngggplot2::ggsave(file.path(dir_fig,"fig_dag_rand.pdf"),plot=fig_dag_rand_normal, dpi=300, width=8,height=8, units="in",scale=1,device = cairo_pdf)ggplot2::ggsave(file.path(dir_fig,"fig_dag_rand.png"),plot=fig_dag_rand_normal, dpi=300, width=8,height=8, units="in",scale=1)# JMIR scaling (max. 1200x1200)ggplot2::ggsave(file.path(dir_fig,"fig_dag_rand_jmir.png"),plot=fig_dag_rand_jmir, dpi=300, width=1200,height=1200, units="px",scale=1)ggplot2::ggsave(file.path(dir_fig,"fig_dag_rand_jmir.pdf"),plot=fig_dag_rand_jmir, dpi=300, width=1200,height=1200, units="px",scale=1, device = cairo_pdf)# JMIR scaling, for TOC (max. 1200x900)ggplot2::ggsave(file.path(dir_fig,"fig_dag_unadjust_jmir_toc.png"),plot=fig_dag_unadjust_jmir_toc, dpi=300, width=1200,height=800, units="px",scale=1)# ********************************************** ## Load rendered figure ## ********************************************** #knitr::include_graphics(file.path(dir_fig,"fig_dag_rand.png"))
Figure 1: Causal directed acyclic graph (DAG) depicting (A) confounding and (B) successful emulation of randomization using g-methods at baseline between the intervention strategy (X) and outcome (Y). Baseline covariates (both time-invariant [Z] and time-varying [L]) and previous diet and physical activity habits (P) must be considered to emulate randomization. Time-varying treatment and covariates are not shown in this DAG to focus on randomization emulation. Subscripts indicate the time points, where 0 represents baseline.
Contrary to dietary habits, data on physical activity habits before baseline were not collected in the NuAge study. In this case, the potential effect of prior physical activity habits will not be accounted for in the models that aim at emulating the sustained physical activity intervention strategy. For the models emulating the sustained diet intervention strategy only, physical activity habits during the study will be used as covariate, hence mitigating the confounding of prior physical activity, at least to some extent.
A successful emulation of randomization requires that there is no unmeasured confounding. However, this is never guaranteed with observational data. Thus, we emphasize our assumptions that 1) the causal graph accurately depicts the relationship under study; and 2) the covariates included are a sufficient set of covariates to address confounding.
Outcomes
The primary outcomes will be the mean end of follow-up values for muscle strength (i.e., handgrip using vigorimeter, elbow flexor, knee extensor) and physical function (i.e., normal and fast walking, “timed up-and-go”). Outcome values were measured according to standardized protocol in NuAge [25].
For secondary outcomes, mean end of follow-up values for a set of relevant variables will be considered by domains:
Cognition: the modified Mini-Mental State Examination (3MS) score.
Time Zero and Follow-up
In the target trial of a sustained lifestyle intervention, participants would be met at baseline and then regularly to ensure that diet and physical activity habits are consistent with the intervention assigned by the random allocation. The hypothetical diet and physical activity intervention would be assigned and initiated at baseline. In the emulation, annual follow-ups with comprehensive diet, physical activity and covariate data collection are available to emulate the hypothetical intervention. Hence, participants would be followed from study baseline (time 0; i.e., the time at which the intervention strategy would also be assigned and would begin), at each year (time 1 and 2) and until the end of the study (time 3). We also assume that the diet and physical activity habits measured at each follow-up time adequately reflect the habits during the full year.
The end of follow-up outcome measurements will be used to estimate the effect of the sustained lifestyle intervention strategy. Measures of dietary intakes and physical activity throughout the study (i.e., time 0 to time 3) will be used to emulate the sustained lifestyle intervention. Dietary intakes in the year prior to the intervention will be estimated using the frequency questionnaire completed at study baseline (time 0). Missing covariate data at a given follow-up will be carried forward once, after which participants will be considered as having incomplete follow-up.
Causal Contrast
The estimand of interest in this study, the target causal effect of a sustained lifestyle intervention strategy, is
that is, the expected value of a given health outcome \(Y\) at the end of follow-up if all participants had increased their adherence to CFG recommendations on healthy food choices and physical activity, when applicable, at all four time points (\(X_k=1\), “always intervene”) vs., instead, if all participants had maintained their habitual diet and physical activity (\(X_k=0\), “never intervene”). The estimand (Equation 1) also indicates that all participants completed the intervention (\(C=0\)), i.e., in absence of incomplete follow-up.
The causal contrasts of interest are the observational analogues of “intention-to-treat” and “per protocol” [11]. Given the observational design, participants are not expected to have followed a treatment strategy unknown to them at the time of data collection. Therefore, the primary analysis will be the per protocol contrast of a sustained lifestyle intervention strategy. In the per protocol analysis, non-adherence to the hypothetical interventions can be accounted for. In the target trial, participants with a condition after baseline that would have prevented or limited participation in a hypothetical lifestyle intervention would be allowed to discontinue the intervention (e.g., lengthy hospitalization, prolonged bed rest, incident cancer). In the emulation, if such conditions occur in a sufficiently large number of participants, these participants will be “excused” from following the hypothetical intervention [23]. In other words, participants that would have been unable to pursue the study due to major events will not be considered as having incomplete follow-up if they attended the annual assessment. Allowing participants to discontinue adhering to the (hypothetical) intervention strategy mitigates confounding by the disease burden [23].
The intention-to-treat analysis will be a secondary analysis of a hypothetical point intervention, e.g., dietary counselling at baseline only. Note that it will not be possible to conduct an intention-to-treat analysis identical to that of a controlled study where the interest is to estimate the effect of being assigned to an intervention [11]. However, it is possible to conduct an “observational analogue” of the intention-to-treat analysis. In the observational analogue, the intention-to-treat analysis aims to estimate the impact of a hypothetical intervention which adherence is measured at baseline only.
Statistical Analysis
Stratification and multivariable regression (i.e., covariate adjustment) are conventional statistical approaches to address confounding in nutritional epidemiology. However, the conventional approaches are not adequate to estimate cumulative treatment effects (e.g., diet over time) in the presence of time-varying confounding (e.g., weight status over time) and treatment (e.g., prior diet) [41,42]. In the present study, non-adherence to the hypothetical interventions and incomplete follow-up will be considered using (general) g methods for the per protocol analysis [11,42]. Among g methods, the parametric g-formula provides the most flexibility for analyses involving hypothetical dietary interventions, as used previously [19,22,43]. Briefly, in the context of an observational study, the parametric g formula, and its implementation into an R package [44], uses parametric models to predict the joint-history of prior diet and physical activity habits (i.e., the hypothetical sustained intervention strategy) and confounding variables. For example, linear regression models are used to predict continuous covariates (e.g., body weight), while logistic regressions are used to predict binary or categorical variables (e.g., indicator variable for dietary supplement use). The per protocol causal contrast of hypothetical intervention presented in Table 2 is then emulated based on Monte Carlo simulated data generated using the g formula algorithm [44]. The parametric g formula correctly accounts for time-varying confounding in the presence of feedback between the intervention and the confounding variables, since confounding is addressed using standardization [41,42]. Furthermore, standardization allows to estimate an average causal effect (i.e., marginal effect) consistent with the estimand of interest (Equation 1) rather than a conditional effect. In summary, a “threshold interventions” that depend on the reported dietary intakes or amount of physical activity [43,45] and the parametric g-formula [44,46] will be used to emulate the intervention of “consuming at least \(x\) servings of food” and “doing at least \(x\) minutes of light to vigorous physical activity”.
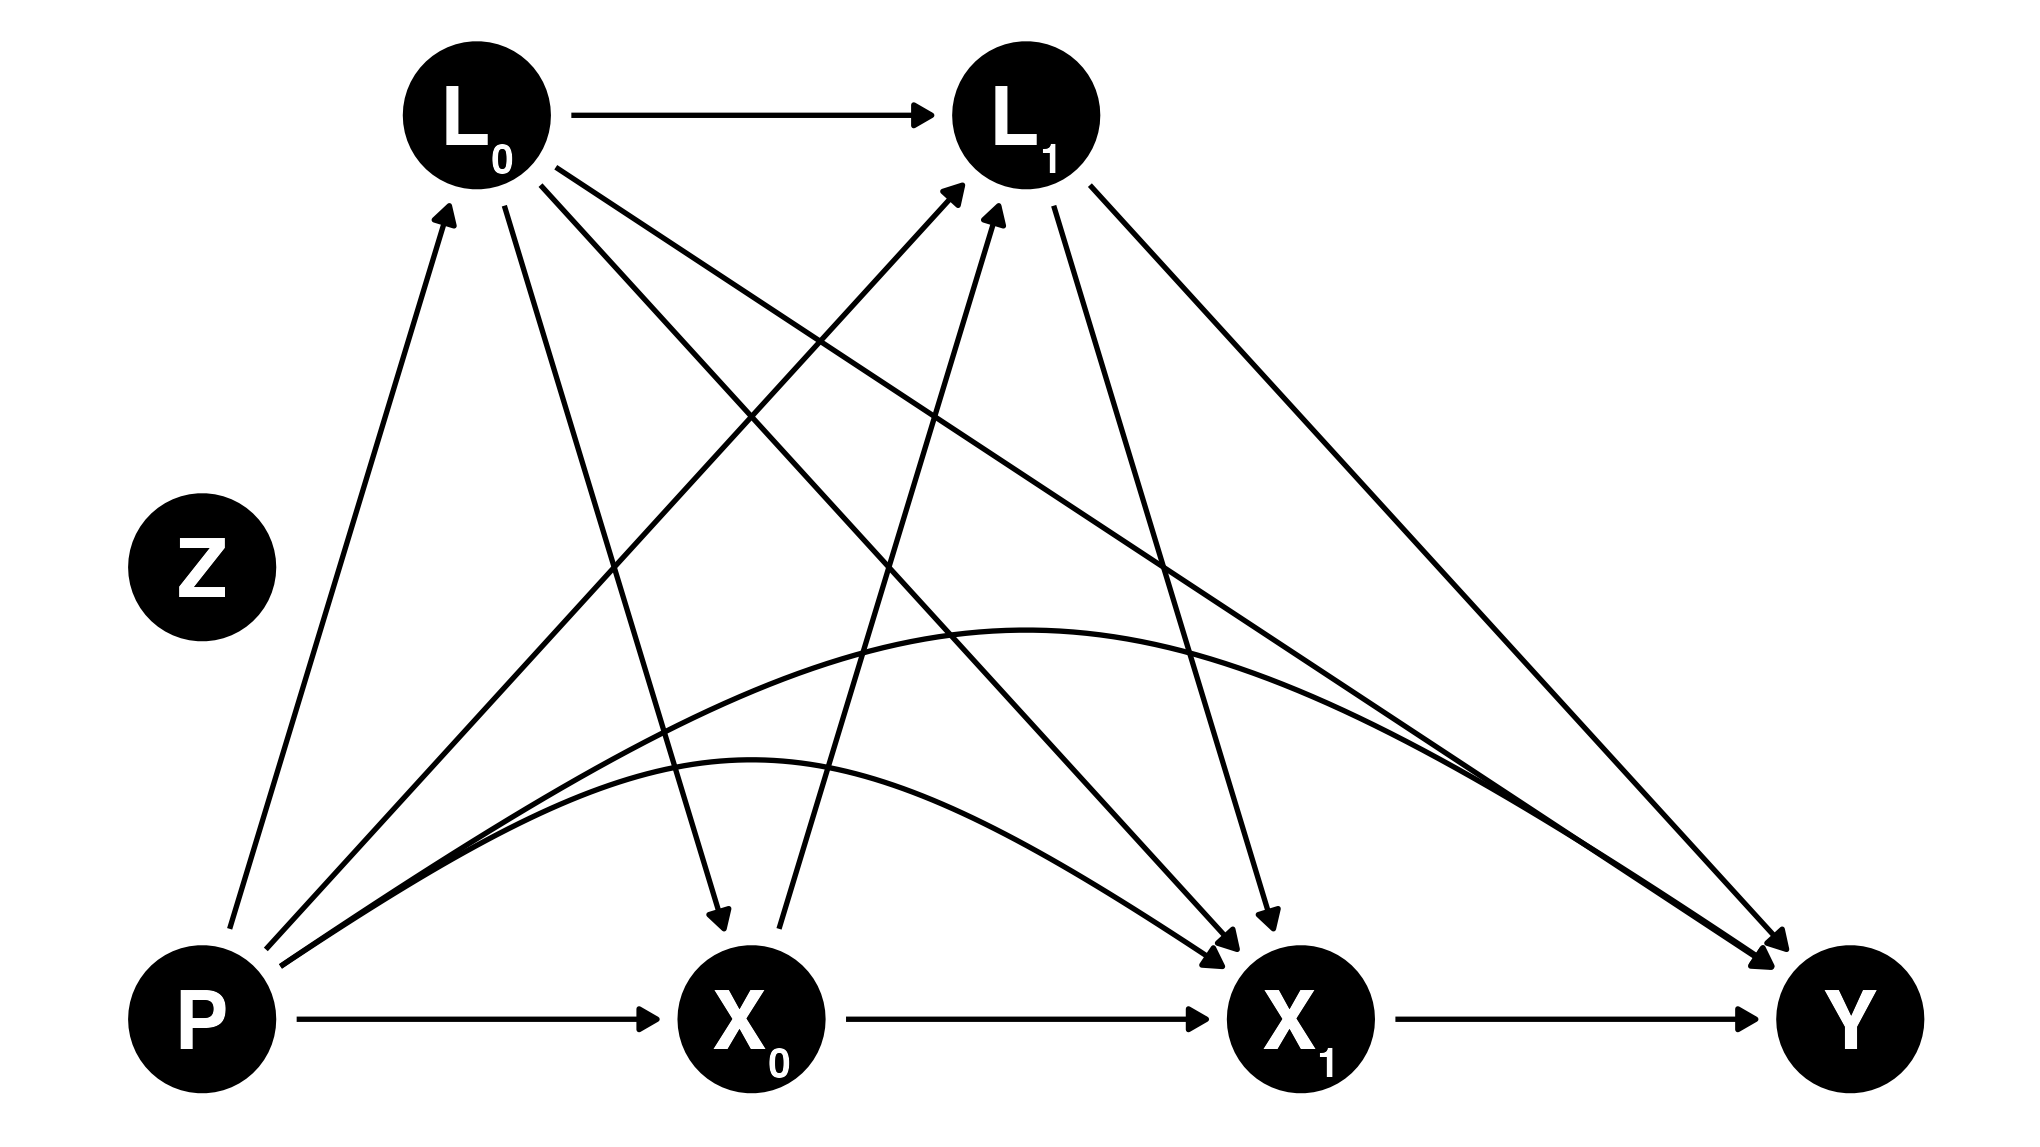
Figure 2 presents the causal DAG of the hypothesized relationship between a sustained lifestyle intervention strategy (\(X_0, X_1\)) and an end of follow-up outcome \(Y\), for one follow-up after baseline (year 1). The model is limited to year 1 for clarity but the hypothesized causal structure extends to additional follow-ups. The exposure of interest \(X_k\) is the joint and cumulative effect of a sustained diet and physical activity intervention strategy measured at baseline and at follow-ups.
In the context of this target trial emulation (Figure 2), \(P\) includes dietary habits prior to the baseline assessment. \(P\) can have an effect on baseline dietary habits (e.g., prior healthy habits increase likelihood of baseline healthy habits) and dietary habits throughout the target trial emulation (e.g., prior healthy habits increase likelihood of adhering to healthy habits). \(P\) also influences baseline and time-varying confounding. Finally, given the long-term effect of chronic exposure, \(P\) potentially also affect \(Y\) directly.
Code
# ********************************************** ## Input Dagitty information ## ********************************************** ## note: time-varying DAG with one follow-up# Daggitty framedag_one_t <- dagitty::dagitty('dag {bb="0,0,1,1""Z" [pos="0.10,0.4"]"P-1" [pos="0.10,0.300",Xdjusted="1"]L0 [pos="0.200,0.500",Xdjusted="1"]L1 [pos="0.400,0.500",Xdjusted="1"]X0 [exposure,pos="0.300,0.300"]X1 [exposure,pos="0.500,0.300"]Y [outcome,pos="0.700,0.300"]"P-1" -> L0"P-1" -> L1"P-1" -> X0"P-1" -> X1 [pos="0.240,0.400"]"P-1" -> Y [pos="0.260,0.500"]L0 -> L1L0 -> X0L0 -> X1L0 -> YL1 -> X1L1 -> YX0 -> L1X0 -> X1X1 -> Y}')# Transform to ggdagdag_one_t <- ggdag::tidy_dagitty(dag_one_t)# Generate second set of coordinates for edge-arc dag_one_t <- dag_one_t |>mutate(## create second set of coordinates for edge-arc# x coordinatesxend_arc =case_when( name=="P-1"& to =="X1"~ xend, name=="P-1"& to =="Y"~ xend ,.default =NA ),# y coordinatesyend_arc =case_when( name=="P-1"& to =="X1"~ yend, name=="P-1"& to =="Y"~ yend ,.default =NA ),# remove straight edge for those flag with arcxend =ifelse(is.na(xend_arc),xend,NA),yend =ifelse(is.na(yend_arc),yend,NA),## z coordinatesxend =ifelse(name=="Z",x+0.1,xend),yend =ifelse(name=="Z",y+0.1,yend) )# add nodes label for ggplotdag_one_t_labels <-data.frame(dag_one_t) |> dplyr::mutate(label =case_when( name =="X0"~"X\u2080", name =="X1"~"X\u2081", name =="L0"~"L\u2080", name =="L1"~"L\u2081", name =="Y"~"Y", name =="P-1"~"P", name =="Z"~"Z") ) |> dplyr::pull(label)# ********************************************** ## Create DAG with ggplot ## ********************************************** #make_dag_one_t <-function(scale_node_size=1, text_size=4, default_node_size=16){ node_size <- default_node_size * scale_node_sizefig_dag_one_t <- dag_one_t |>ggplot(aes(x = x,y = y,xend = xend,yend = yend )) +geom_dag_point(size = node_size) +geom_dag_edges() +geom_dag_edges_arc(aes(xend=xend_arc,yend=yend_arc), curvature=0.25) +geom_dag_text(aes(label=dag_one_t_labels), size=text_size) +theme_dag() +theme(plot.background =element_rect(colour="white") ) return(fig_dag_one_t)}# Generate figure for different layout## normal versionfig_dag_one_t_normal <-make_dag_one_t(text_size=7)## JMIR formatfig_dag_one_t_jmir <-make_dag_one_t(scale_node_size=0.5, text_size=3.5) +theme(plot.caption=element_text(size=6))# ********************************************** ## Save as png/pdf ## ********************************************** #ggplot2::ggsave(file.path(dir_fig,"fig_dag_1t.pdf"),plot=fig_dag_one_t_normal, dpi=300, width=8,height=4.5, units="in",scale=0.85,device = cairo_pdf)ggplot2::ggsave(file.path(dir_fig,"fig_dag_1t.png"),plot=fig_dag_one_t_normal, dpi=300, width=8,height=4.5, units="in",scale=0.85)ggplot2::ggsave(file.path(dir_fig,"fig_dag_1t_jmir.png"),plot=fig_dag_one_t_jmir, dpi=300, width=1200,height=800, units="px",scale=1)# ********************************************** ## Load rendered figure ## ********************************************** # knitr::include_graphics(file.path(dir_fig,"fig_dag_1t.png"))
Figure 2: Directed acyclic graph (DAG) depicting the hypothesized relationship among previous dietary exposure, time-varying interventions (diet and physical activity), and covariates. Arrows from the Z node are not shown for clarity but would point toward all baseline and time-varying nodes, as well as the outcome. Only 1 follow-up is shown for visualization purposes, but the hypothesized causal structure extends to additional follow-ups. Subscripts indicate the time points, where 0 represents baseline and 1 represents time point 1.
The intention-to-treat analysis is similar to the per protocol analysis. However, only baseline diet and physical activity habits and covariates are considered as well as pre-baseline diet and physical activity. In both the per protocol and intention-to-treat analyses, loss to follow-up (e.g., non-response or missing follow-up, health outcomes not measured) will be accounted for using g-methods such as inverse probability weighting.
Dietary Assessment
In the NuAge study, diet during the year before baseline was assessed using one semi-quantitative food-frequency questionnaire [47]. Dietary intakes at baseline (time 0) and each annual follow-ups (time 1, 2 and 3) were assessed using 3 repeated face-to-face interviewer-administered 24-hour dietary recall.
Dietary intakes measured using 24-h dietary recall are more accurate (i.e., less systematic error or bias) than food-frequency questionnaire [48–50] but are particularly affected by random measurement error (i.e., within-individual random error) [50]. When several variables measured with errors are considered simultaneously in a regression model, the regression coefficients may be biased in any direction [51]. To account for random measurement error, the National Cancer Institute Markov Chain Monte Carlo (MCMC) multivariate method could be applied [52]. However, the combination of the parametric g-formula and multivariate measurement error correction using the NCI MCMC method is not feasible. The NCI MCMC method estimates time-invariant measurement error-corrected intakes, while the g formula algorithm is designed for time-varying exposures.
Recognizing the importance of accounting for measurement error, the correction for measurement error will be reserved for the secondary intention-to-treat analysis. For the intention-to-treat contrast, the time-varying values of exposure and the time-varying values of confounding are not considered. Thus, the NCI MCMC method will be used to obtain measurement error-corrected estimates of the relationship between dietary intakes measured at baseline and outcome at the end of follow-up. Of note, the three 24-h dietary recalls collected at each time point contribute to reducing random errors, at least to some extent, even in absence of measurement error correction.
Sensitivity analysis to assess the impact of measurement error
For the secondary intention-to-treat analysis, results based on the measurement error-corrected and uncorrected dietary intakes will be compared. The difference between the estimated relationships will allow to extrapolate the impact of not accounting for random errors in the primary per protocol analysis.
Physical activity assessment
Physical activity throughout the study was assessed using the Physical Activity Scale for the Elderly (PASE) questionnaire [53,54]. Rather than the total PASE score, specific questions estimating the total time of physical activities will be used to be consistent with the intervention strategy.
Covariates and subgroups
To the extent permitted by the number of observations for each outcome, continuous covariates will be modelled using restricted cubic splines with 3 to 5 knots (at percentiles 10-50-90, 5-35-65-95 or 5-27.5-50-77.5-95) [55]. Categorical covariates will be modelled to ensure a sufficient sample size in each level.
The effect of dietary changes will be estimated for the full sample. The sample will also be stratified by (biological) sex to reflect both potential biological differences and, to some extent, gender differences (although not reported).
Variance estimation
Variance will be estimated using a minimum of 200 bootstrap sample replicates to consider uncertainty at each step of the estimation [56].
Software and code
The main statistical analyses will be conducted using R (version 4.3.1 or greater) and the gfoRmula package [44,57]. The manuscript results will be generated using Quarto markdown. Codes for main analyses and generation of manuscript results will be shared in a publicly available code repository.
Ethical Considerations
Human subject ethics review approvals or exemptions
The original NuAge study protocol was approved by the Research Ethics Boards of the Institut universitaire de gériatrie de Montréal and the Institut universitaire de gériatrie de Sherbrooke (Quebec, Canada). The NuAge Database and Biobank [58] has received approval by the Research Ethics Board of the Centre intégré universitaire de santé et de services sociaux de l’Estrie—Centre hospitalier universitaire de Sherbrooke. Secondary analyses of data from the NuAge Database and Biobank for the study described in this protocol are approved by the McGill University Research Ethics Board Office (#22-11-041).
Informed Consent
All participants of the NuAge study provided informed consent. From the initial cohort of 1,793 participants, 1,753 (98%) agreed to the integration of their data and biological samples into the NuAge Database and Biobank for future studies.
Privacy and confidentiality
Secondary analyses based on the NuAge Database and Biobank use de-identified data, which do not allow participants to be identified by the investigators.
Compensation details
Participants from the NuAge study voluntarily consented to participate and were not provided with monetary compensation.
Results
Data collection for the NuAge study was completed in June 2008. For the present work, the main analysis based on the final curated data started in May 2024. The manuscript will be written according to the Strengthening the Reporting of Observational Studies in Epidemiology (STROBE) statement. We anticipate the submission of the manuscript to peer-reviewed academic journal by December 2024.
Discussion
In this study protocol, we have described a target trial to assess the effect of adhering to CFG’s recommendations on healthy food choices. The emulation will be performed using data from the NuAge Database and Biobank [58]. Benefiting from the flexibility of observational data, we also aim to compare adherence to multiple reformulations of CFG’s recommendations, including the effect of increasing the intake of protein-rich foods and the amount of aerobic physical activity on selected health outcomes. We have also described the rationale for using simulated diets to emulate the adherence to CFG’s recommendations, the process of selecting covariates - to attempt - to emulate randomization with causal diagrams, and the challenges of addressing random measurement error.
We emphasize that the purpose of emulating a target trial using observational data is to improve the quality of observational analysis [11,14]. In other words, the target trial framework aims to support the coherence between the (causal) research question and the observational data analysis [26]. However, estimating causal effects with non-experimental observational data depends on strong assumptions. The key assumptions are that there are no unmeasured confounder, no measurement error and no model misspecification (e.g., functional form of covariates, model outcome distribution) [19]. We first recognize that the absence of residual or unmeasured confounding cannot be guaranteed. The extent to which this assumption is sufficiently satisfied depends on the appraisal of covariates considered. In that regard, we have used graphical tools, DAG, to explicitly describe our analytical assumptions and to identify confounding variables [59–61]. Second, the absence of measurement error assumption will not be satisfied considering the use of dietary intake data measured with 24-h dietary recalls. On one hand, 24-h dietary recalls have the least systematic error (bias) compared with other common instruments such as food-frequency questionnaire [48,49]. On the other hand, 24-h dietary recalls are largely affected by within-individual random errors [50], which can cause bias in any direction in multivariable models [51], as in the present study. This issue is mitigated, at least to some extent, by using average data from three repeated 24-h dietary recalls at each follow-up. Sensitivity analyses comparing estimates based on measurement-error corrected and uncorrected baseline dietary intakes will be used to assess the impact of random measurement errors. Third, the absence of model misspecification will be assessed by examining differences between the observed value of time-varying covariates and the predicted value of time-varying covariates as modeled with the g-formula.
Limitations
Strengths of this study and protocol include the explicit emulation of a hypothetical trial, the thorough description of the emulation of the sustained dietary intervention, and the use of background knowledge and DAG to derive a sufficient set of confounders. Limitations must be addressed. First, the sample size of the NuAge study is relatively limited (n=1753), although comprehensive nutrition and covariate data was collected. Second, the target food intakes based on diet simulations from Health Canada exceed the 99th percentile of the usual intake distribution of Canadians 65 years or older from Canada in 2015 [3]. The a posteriori revision of the dietary intervention targets will be needed if observed dietary intakes in NuAge are too far from targets (Table 2), as was done in a previous nutrition target trial emulation [22]. Third, the presence of random measurement error associated with 24-h dietary recalls may bias estimates. Finally, the target trial emulation cannot replace an actual RCT. Evidence from RCT will be required to confirm the value of either CFG recommendations or the enhanced CFG recommendations.
Conclusion
In conclusion, the target trial framework is relevant to estimate the causal effect of adhering to CFG’s recommendations using non-experimental data when a RCT is impractical [11,19]. Coupled with key assumptions, including the absence of unmeasured confounding, the absence of measurement error and no model misspecification, we believe the emulation will provide timely evidence regarding the effect of adhering to CFG’s recommendations in older adults and inform on the added value of a reformulation.
Acknowledgements
Authors’ contributions
Conceptualization: all authors; Methodology: DB and SC; Data curation, formal analysis, visualization and writing – original draft: DB; Supervision: SC; Writing – review & editing: all authors.
Conflicts of Interest
DB was a casual employee of Health Canada (2019-2020) and held a doctoral training award from the Fonds de recherche du Québec – Santé (2019-2021). DB has no conflicts of interest. SC receives research funding from the CIHR, Fonds de recherche du Québec, Canadian Foundation for Dietetics Research, Canadian Foundation for Innovation and Canadian Cancer Society. None of these agencies has funded nor was involved in this work.
NP is the NuAge Database Administrator; NP and SC serve as NuAge Steering Committee Members.
The NuAge Study was supported by a research grant from the Canadian Institutes of Health Research (CIHR; MOP-62842). The NuAge Database and Biobank are supported by the Fonds de recherche du Québec (FRQ; 2020-VICO-279753), the Quebec Network for Research on Aging, a thematic network funded by the Fonds de Recherche du Québec - Santé (FRQS) and by the Merck-Frosst Chair funded by La Fondation de l’Université de Sherbrooke.
Funding statement
This work was supported by a Canadian Institutes of Health Research (CIHR) Fellowship award (MFE-181852) to DB.
Data availability and code
The data and code used for this manuscript will be made available at https://github.com/didierbrassard/NuAge_protocol
Multimedia Appendix 1: Supplemental Table 1. HEFI-2019 dietary constituents and score among simulated diets by Health Canada, by age and sex group
Brassard D, Chevalier S. Relationship between adherence to the 2019 canada’s food guide recommendations on healthy food choices and nutrient intakes in older adults. J Nutr 2023;153(9):2699–2708. doi: 10.1016/j.tjnut.2023.07.005
Mills CM, Keller HH, DePaul VG, Donnelly C. Factors associated with the development of high nutrition risk: Data from the canadian longitudinal study on aging. Can J Aging 2023;1–14. doi: 10.1017/S0714980823000545
6.
Bauer J, Biolo G, Cederholm T, Cesari M, Cruz-Jentoft AJ, Morley JE, Phillips S, Sieber C, Stehle P, Teta D, Visvanathan R, Volpi E, Boirie Y. Evidence-based recommendations for optimal dietary protein intake in older people: A position paper from the PROT-AGE study group. J Am Med Dir Assoc 2013;14(8):542–59. doi: 10.1016/j.jamda.2013.05.021
7.
Deutz NE, Bauer JM, Barazzoni R, Biolo G, Boirie Y, Bosy-Westphal A, Cederholm T, Cruz-Jentoft A, Krznaric Z, Nair KS, Singer P, Teta D, Tipton K, Calder PC. Protein intake and exercise for optimal muscle function with aging: Recommendations from the ESPEN expert group. Clin Nutr 2014;33(6):929–36. doi: 10.1016/j.clnu.2014.04.007
8.
Paddon-Jones D, Campbell WW, Jacques PF, Kritchevsky SB, Moore LL, Rodriguez NR, Loon LJ van. Protein and healthy aging. Am J Clin Nutr 2015;101(6):1339S–1345S. doi: 10.3945/ajcn.114.084061
9.
Remond D, Shahar DR, Gille D, Pinto P, Kachal J, Peyron MA, Dos Santos CN, Walther B, Bordoni A, Dupont D, Tomas-Cobos L, Vergeres G. Understanding the gastrointestinal tract of the elderly to develop dietary solutions that prevent malnutrition. Oncotarget 2015;6(16):13858–98. doi: 10.18632/oncotarget.4030
10.
Shlisky J, Bloom DE, Beaudreault AR, Tucker KL, Keller HH, Freund-Levi Y, Fielding RA, Cheng FW, Jensen GL, Wu D, Meydani SN. Nutritional considerations for healthy aging and reduction in age-related chronic disease. Adv Nutr 2017;8(1):17–26. doi: 10.3945/an.116.013474
11.
Hernan MA, Robins JM. Using big data to emulate a target trial when a randomized trial is not available. Am J Epidemiol 2016;183(8):758–64. doi: 10.1093/aje/kwv254
12.
Kutcher SA, Brophy JM, Banack HR, Kaufman JS, Samuel M. Emulating a randomised controlled trial with observational data: An introduction to the target trial framework. Can J Cardiol 2021;37(9):1365–1377. doi: 10.1016/j.cjca.2021.05.012
13.
Tobias DK, Lajous M. What would the trial be? Emulating randomized dietary intervention trials to estimate causal effects with observational data. Am J Clin Nutr 2021;114(2):416–417. doi: 10.1093/ajcn/nqab169
14.
Hernan MA, Wang W, Leaf DE. Target trial emulation: A framework for causal inference from observational data. JAMA 2022;328(24):2446–2447. doi: 10.1001/jama.2022.21383
15.
Stern D, Ibsen DB, MacDonald CJ, Chiu YH, Lajous M, Tobias DK. Improving nutrition science begins with asking better questions. Am J Epidemiol 2024;193(11):1507–1510. doi: 10.1093/aje/kwae110
16.
Tobias DK. What eggsactly are we asking here? Unscrambling the epidemiology of eggs, cholesterol, and mortality. Circulation 2022;145(20):1521–1523. doi: 10.1161/CIRCULATIONAHA.122.059393
17.
Tomova GD, Arnold KF, Gilthorpe MS, Tennant PWG. Adjustment for energy intake in nutritional research: A causal inference perspective. Am J Clin Nutr 2022;115(1):189–198. doi: 10.1093/ajcn/nqab266
18.
Hernan MA, Sauer BC, Hernandez-Diaz S, Platt R, Shrier I. Specifying a target trial prevents immortal time bias and other self-inflicted injuries in observational analyses. J Clin Epidemiol 2016;79:70–75. doi: 10.1016/j.jclinepi.2016.04.014
19.
Chiu YH, Chavarro JE, Dickerman BA, Manson JE, Mukamal KJ, Rexrode KM, Rimm EB, Hernan MA. Estimating the effect of nutritional interventions using observational data: The american heart association’s 2020 dietary goals and mortality. Am J Clin Nutr 2021;114(2):690–703. doi: 10.1093/ajcn/nqab100
20.
Berkowitz SA, Basu S, Hanmer J. Eliminating food insecurity in the USA: A target trial emulation using observational data to estimate effects on health-related quality of life. J Gen Intern Med 2023;38(10):2308–2317. doi: 10.1007/s11606-023-08095-6
21.
Bonekamp NE, Cruijsen E, Visseren FL, Schouw YT van der, Geleijnse JM, Koopal C. Compliance with the DASH diet and risk of all-cause and cardiovascular mortality in patients with myocardial infarction. Clin Nutr 2023;42(8):1418–1426. doi: 10.1016/j.clnu.2023.06.033
22.
Ibsen DB, Chiu YH, Gemes K, Wolk A. Hypothetical 22-year intervention with DASH diet lowered risk of heart failure in a general population. Am J Epidemiol 2023; doi: 10.1093/aje/kwad181
23.
Dickerman BA, Giovannucci E, Pernar CH, Mucci LA, Hernan MA. Guideline-based physical activity and survival among US men with nonmetastatic prostate cancer. Am J Epidemiol 2019;188(3):579–586. doi: 10.1093/aje/kwy261
24.
Guo F, McGee EE, Chiu YH, Giovannucci E, Mucci LA, Dickerman BA. Evaluating recommendation-based dietary and physical activity strategies for prostate cancer prevention: A target trial emulation in the health professionals follow-up study. Am J Epidemiol 2024; doi: 10.1093/aje/kwae184
25.
Gaudreau P, Morais JA, Shatenstein B, Gray-Donald K, Khalil A, Dionne I, Ferland G, Fulop T, Jacques D, Kergoat MJ, Tessier D, Wagner R, Payette H. Nutrition as a determinant of successful aging: Description of the quebec longitudinal study nuage and results from cross-sectional pilot studies. Rejuvenation Res 2007;10(3):377–86. doi: 10.1089/rej.2007.0596
26.
Hernan MA. The c-word: Scientific euphemisms do not improve causal inference from observational data. Am J Public Health 2018;108(5):616–619. doi: 10.2105/AJPH.2018.304337
27.
Goetghebeur E, Cessie S le, De Stavola B, Moodie EE, Waernbaum I, Causal Inference of the S initiative on behalf of" the topic group. Formulating causal questions and principled statistical answers. Stat Med 2020;39(30):4922–4948. doi: 10.1002/sim.8741
28.
Haber NA, Wieten SE, Rohrer JM, Arah OA, Tennant PWG, Stuart EA, Murray EJ, Pilleron S, Lam ST, Riederer E, Howcutt SJ, Simmons AE, Leyrat C, Schoenegger P, Booman A, Dufour MK, O’Donoghue AL, Baglini R, Do S, Takashima MR, Evans TR, Rodriguez-Molina D, Alsalti TM, Dunleavy DJ, Meyerowitz-Katz G, Antonietti A, Calvache JA, Kelson MJ, Salvia MG, Parra CO, Khalatbari-Soltani S, McLinden T, Chatton A, Seiler J, Steriu A, Alshihayb TS, Twardowski SE, Dabravolskaj J, Au E, Hoopsick RA, Suresh S, Judd N, Pena S, Axfors C, Khan P, Rivera Aguirre AE, Odo NU, Schmid I, Fox MP. Causal and associational language in observational health research: A systematic evaluation. Am J Epidemiol 2022; doi: 10.1093/aje/kwac137
29.
Brassard D, Elvidge Munene LA, St-Pierre S, Guenther PM, Kirkpatrick SI, Slater J, Lemieux S, Jessri M, Haines J, Prowse R, Olstad DL, Garriguet D, Vena J, Vatanparast H, L’Abbe MR, Lamarche B. Development of the healthy eating food index (HEFI)-2019 measuring adherence to canada’s food guide 2019 recommendations on healthy food choices. Appl Physiol Nutr Metab 2022;47(5):595–610. doi: 10.1139/apnm-2021-0415
30.
Hernan MA. Does water kill? A call for less casual causal inferences. Ann Epidemiol 2016;26(10):674–680. doi: 10.1016/j.annepidem.2016.08.016
31.
Chiu YH. Well-defined interventions for nutritional studies: From target trials to nutritional modeling. Am J Clin Nutr 2022;115(1):3–5. doi: 10.1093/ajcn/nqab343
32.
Kipnis V, Freedman LS, Brown CC, Hartman A, Schatzkin A, Wacholder S. Interpretation of energy adjustment models for nutritional epidemiology. Am J Epidemiol 1993;137(12):1376–80. doi: 10.1093/oxfordjournals.aje.a116647
33.
Tomova GD, Gilthorpe MS, Tennant PWG. Theory and performance of substitution models for estimating relative causal effects in nutritional epidemiology. Am J Clin Nutr 2022;116(5):1379–88. doi: 10.1093/ajcn/nqac188
Brassard D, Elvidge Munene LA, St-Pierre S, Gonzalez A, Guenther PM, Jessri M, Vena J, Olstad DL, Vatanparast H, Prowse R, Lemieux S, L’Abbe MR, Garriguet D, Kirkpatrick SI, Lamarche B. Evaluation of the healthy eating food index (HEFI)-2019 measuring adherence to canada’s food guide 2019 recommendations on healthy food choices. Appl Physiol Nutr Metab 2022;47(5):582–594. doi: 10.1139/apnm-2021-0416
36.
Willett W. Nutritional epidemiology. 3rd ed. Oxford: Oxford University Press; 2013. p. 529. ISBN:9780199754038 (hardcover alk. paper)
37.
Willett WC, Stampfer M, Tobias DK. Re: Adjustment for energy intake in nutritional research: A causal inference perspective. Am J Clin Nutr 2022;116(2):608–609. doi: 10.1093/ajcn/nqac114
38.
Harrison S, Brassard D, Garriguet D, Lemieux S, Lamarche B. A food-level substitution analysis assessing the impact of replacing regular-fat dairy with lower fat dairy on saturated fat intake at a population level in canada. Am J Clin Nutr 2021;114(5):1830–1836. doi: 10.1093/ajcn/nqab251
39.
Harrison S, Lemieux S, Lamarche B. Assessing the impact of replacing foods high in saturated fats with foods high in unsaturated fats on dietary fat intake among canadians. Am J Clin Nutr 2022;115(3):877–885. doi: 10.1093/ajcn/nqab420
40.
Daly RM, O’Connell SL, Mundell NL, Grimes CA, Dunstan DW, Nowson CA. Protein-enriched diet, with the use of lean red meat, combined with progressive resistance training enhances lean tissue mass and muscle strength and reduces circulating IL-6 concentrations in elderly women: A cluster randomized controlled trial. Am J Clin Nutr 2014;99(4):899–910. doi: 10.3945/ajcn.113.064154
41.
Naimi AI, Cole SR, Kennedy EH. An introduction to g methods. Int J Epidemiol 2017;46(2):756–762. doi: 10.1093/ije/dyw323
42.
Igelström E, Craig P, Lewsey J, Lynch J, Pearce A, Katikireddi SV. Causal inference and effect estimation using observational data. Journal of Epidemiology and Community Health 2022;76(11):960. doi: 10.1136/jech-2022-219267
43.
Taubman SL, Robins JM, Mittleman MA, Hernan MA. Intervening on risk factors for coronary heart disease: An application of the parametric g-formula. Int J Epidemiol 2009;38(6):1599–611. doi: 10.1093/ije/dyp192
44.
McGrath S, Lin V, Zhang Z, Petito LC, Logan RW, Hernán MA, Young JG. gfoRmula: An r package for estimating the effects of sustained treatment strategies via the parametric g-formula. Patterns 2020;1(3). doi: 10.1016/j.patter.2020.100008
45.
Young JG, Hernan MA, Robins JM. Identification, estimation and approximation of risk under interventions that depend on the natural value of treatment using observational data. Epidemiol Methods 2014;3(1):1–19. doi: 10.1515/em-2012-0001
46.
Robins J. A new approach to causal inference in mortality studies with a sustained exposure period—application to control of the healthy worker survivor effect. Mathematical Modelling 1986;7(9):1393–1512. doi: https://doi.org/10.1016/0270-0255(86)90088-6
47.
Shatenstein B, Nadon S, Godin C, Ferland G. Development and validation of a food frequency questionnaire. Can J Diet Pract Res 2005;66(2):67–75. doi: 10.3148/66.2.2005.67
48.
Freedman LS, Commins JM, Moler JE, Arab L, Baer DJ, Kipnis V, Midthune D, Moshfegh AJ, Neuhouser ML, Prentice RL, Schatzkin A, Spiegelman D, Subar AF, Tinker LF, Willett W. Pooled results from 5 validation studies of dietary self-report instruments using recovery biomarkers for energy and protein intake. Am J Epidemiol 2014;180(2):172–88. doi: 10.1093/aje/kwu116
49.
Freedman LS, Commins JM, Moler JE, Willett W, Tinker LF, Subar AF, Spiegelman D, Rhodes D, Potischman N, Neuhouser ML, Moshfegh AJ, Kipnis V, Arab L, Prentice RL. Pooled results from 5 validation studies of dietary self-report instruments using recovery biomarkers for potassium and sodium intake. Am J Epidemiol 2015;181(7):473–87. doi: 10.1093/aje/kwu325
50.
Thompson FE, Kirkpatrick SI, Subar AF, Reedy J, Schap TE, Wilson MM, Krebs-Smith SM. The national cancer institute’s dietary assessment primer: A resource for diet research. J Acad Nutr Diet 2015;115(12):1986–95. doi: 10.1016/j.jand.2015.08.016
51.
Keogh RH, Shaw PA, Gustafson P, Carroll RJ, Deffner V, Dodd KW, Kuchenhoff H, Tooze JA, Wallace MP, Kipnis V, Freedman LS. STRATOS guidance document on measurement error and misclassification of variables in observational epidemiology: Part 1-basic theory and simple methods of adjustment. Stat Med 2020;39(16):2197–2231. doi: 10.1002/sim.8532
52.
Zhang S, Midthune D, Guenther PM, Krebs-Smith SM, Kipnis V, Dodd KW, Buckman DW, Tooze JA, Freedman L, Carroll RJ. A new multivariate measurement error model with zero-inflated dietary data, and its application to dietary assessment. Ann Appl Stat 2011;5(2B):1456–1487. doi: 10.1214/10-AOAS446
53.
Washburn RA, Smith KW, Jette AM, Janney CA. The physical activity scale for the elderly (PASE): Development and evaluation. J Clin Epidemiol 1993;46(2):153–62. doi: 10.1016/0895-4356(93)90053-4
54.
Washburn RA, McAuley E, Katula J, Mihalko SL, Boileau RA. The physical activity scale for the elderly (PASE): Evidence for validity. J Clin Epidemiol 1999;52(7):643–51. doi: 10.1016/s0895-4356(99)00049-9
55.
Kyle RP, Moodie EEM, Klein MB, Abrahamowicz M. Evaluating flexible modeling of continuous covariates in inverse-weighted estimators. Am J Epidemiol 2019;188(6):1181–1191. doi: 10.1093/aje/kwz004
Database N, Biobank. Database and biobank of the quebec longitudinal study on nutrition and successful aging. 2024. Available from: https://nuage.recherche.usherbrooke.ca
Tennant PWG, Murray EJ, Arnold KF, Berrie L, Fox MP, Gadd SC, Harrison WJ, Keeble C, Ranker LR, Textor J, Tomova GD, Gilthorpe MS, Ellison GTH. Use of directed acyclic graphs (DAGs) to identify confounders in applied health research: Review and recommendations. Int J Epidemiol 2021;50(2):620–632. doi: 10.1093/ije/dyaa213
CFG: Canada’s Food Guide
DAG: directed acyclic graph
HEFI: Healthy Eating Food Index 2019
MCMC: Markov Chain Monte Carlo
NCI: National Cancer Institute
RA: Reference amount
RCT: randomized controlled trial